Fleet Observability & Alerting (Zabbix)
Project information
- Category: SysOps
- Client: Waletech (INSTAR Germany) Shenzhen, China
- Project date: 01 March, 2018
- Project URL: www.zabbix.com
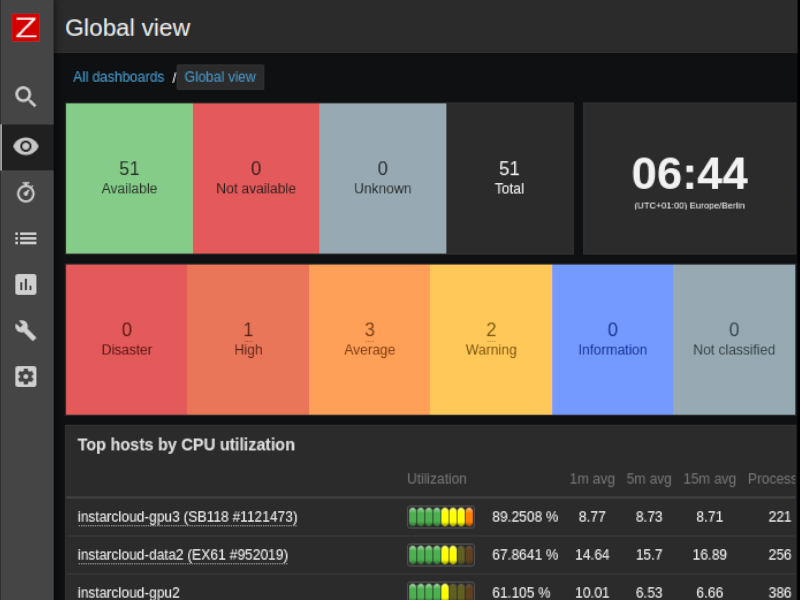
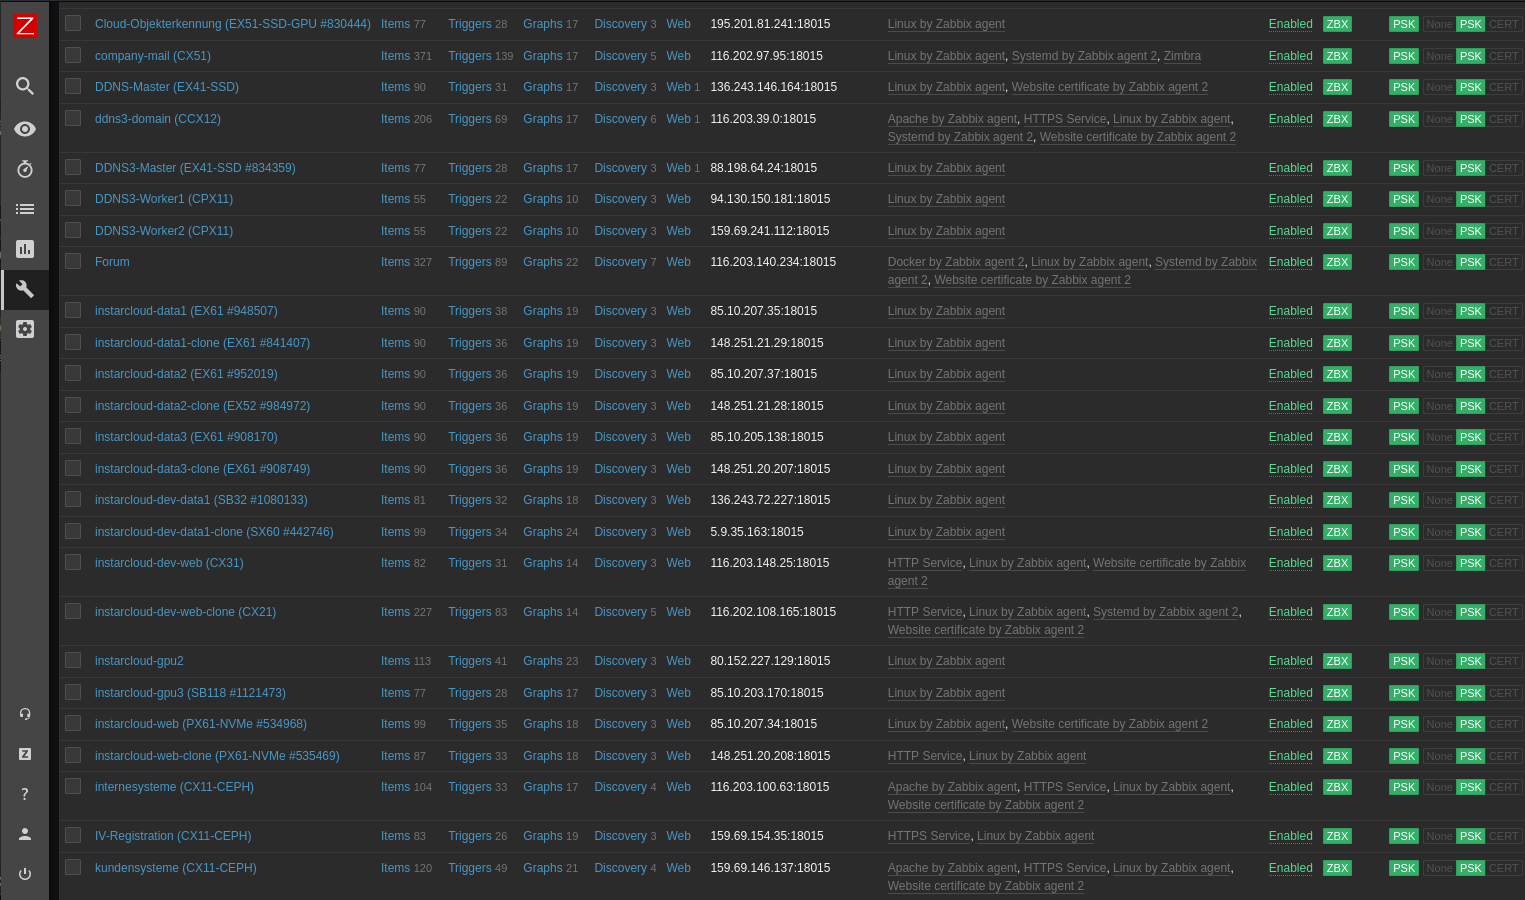
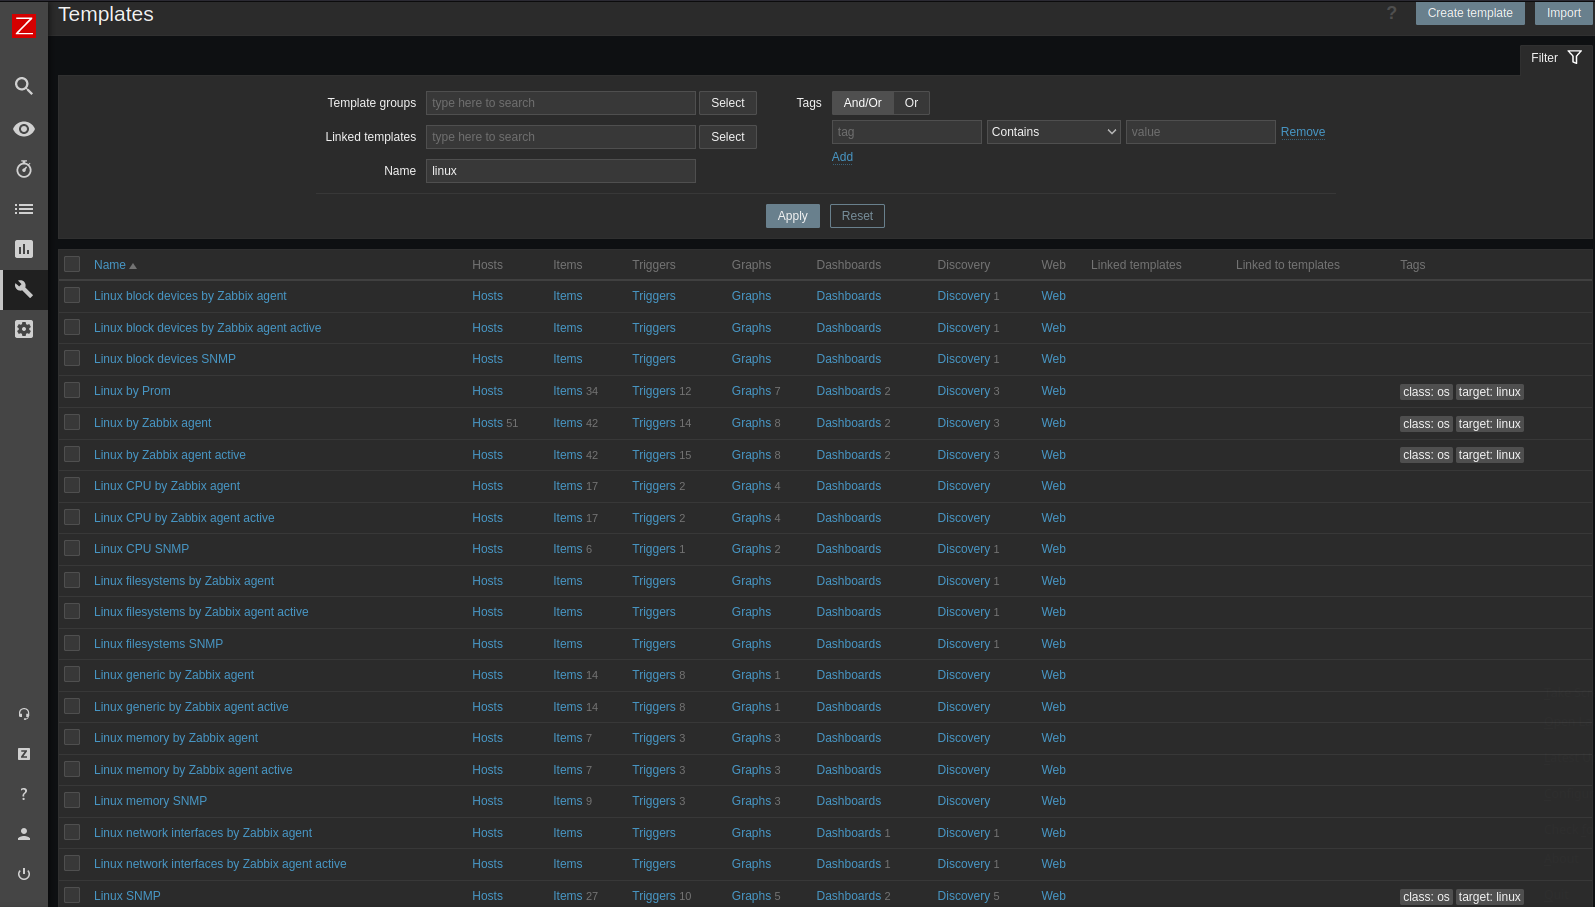
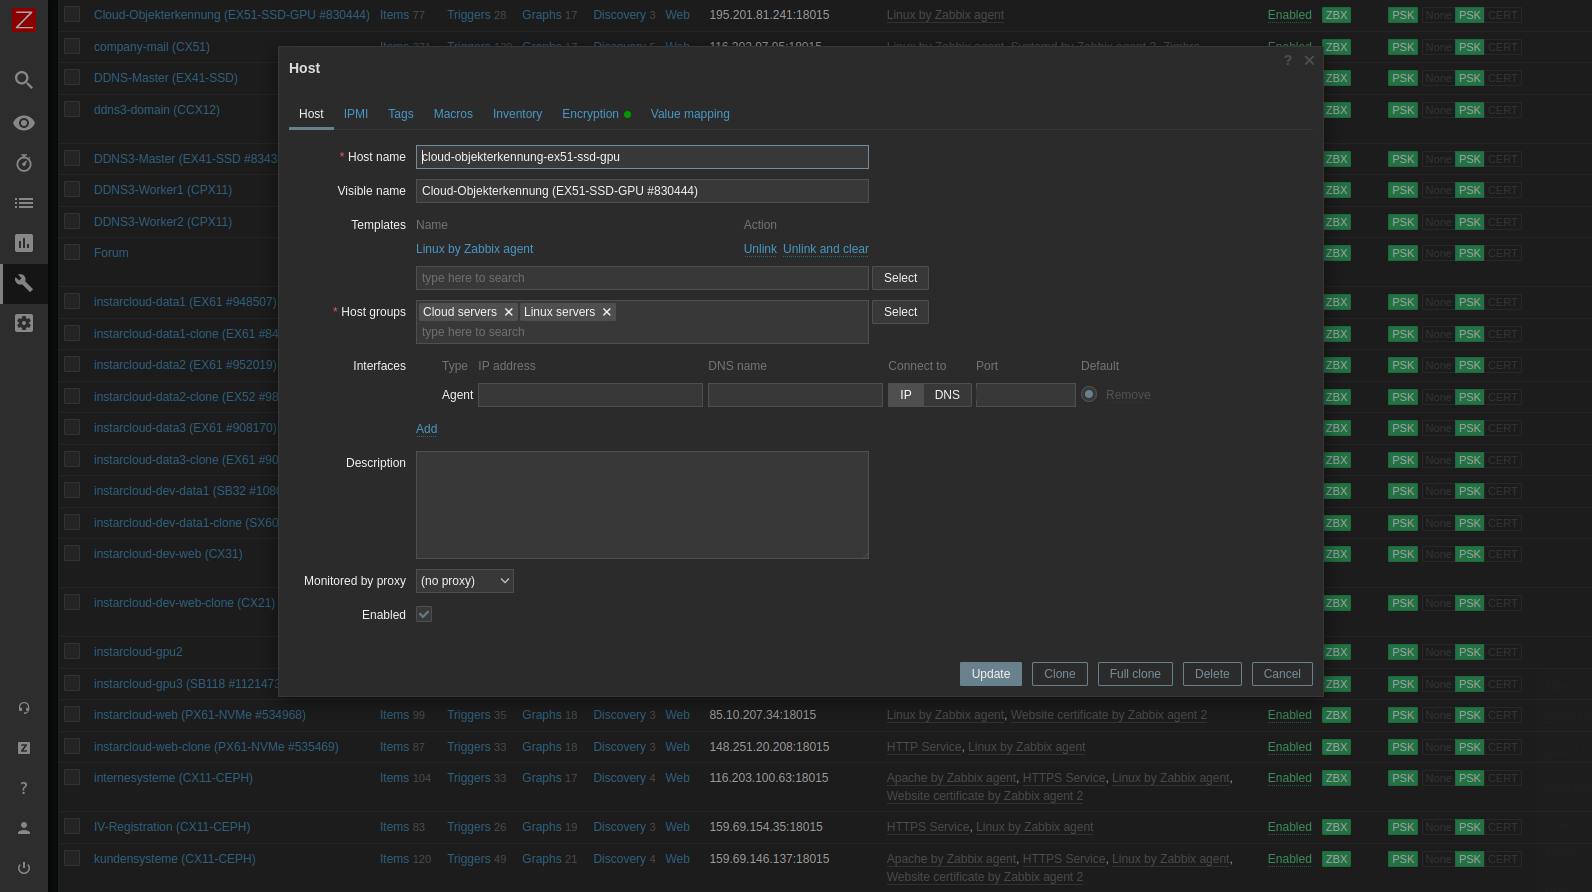
The problem: on a growing fleet, we were learning about outages from customers, not from our dashboards. What I did: Integrated Zabbix across the full fleet — CPU, memory, disk, network saturation, plus custom health-check API probes for every customer-facing service. The Zabbix server itself is containerized on Nomad against a PostgreSQL backend — server, frontend, and database in one job with canary-safe rollout and a health-gated deploy, so the monitoring stack is as fault-tolerant as the things it watches. I sized the Zabbix proxy/server caches (history, trend, value caches) for our event volume and tuned ulimits for the connection counts. System-critical variables feed per-service dashboards, with email and Slack alerts on threshold breach. The payoff: the cloud team gets paged on degradation, not on a support ticket — and the Zabbix dashboards are the same ones the AI pipeline project above relies on.