Kubernetes Cluster Monitoring & Logging

Prometheus and Grafana
Prometheus is an open-source monitoring solution that can be used with the visualization frontend Grafana to display your clusters health status. To install them we are going to use the Helm Package Manager for Kubernetes.
Helm Installation
Helm helps you manage Kubernetes applications — Helm Charts helps you define, install, and upgrade even the most complex Kubernetes application. Charts are easy to create, version, share, and publish — so start using Helm and stop the copy-and-paste.
To install Helm, head over to their Github Page and grab the link to the install binaries - in my case the latest version is Helm v2.12.3. Use this link to download the binaries to your Centos server:
wget https://storage.googleapis.com/kubernetes-helm/helm-v2.12.3-linux-amd64.tar.gz
tar zxvf helm-v2.12.3-linux-amd64.tar.gz
The unzipped folder contains a file called helm that needs to be copied to cp helm /usr/local/bin/. You can type helm to verify that it is working:

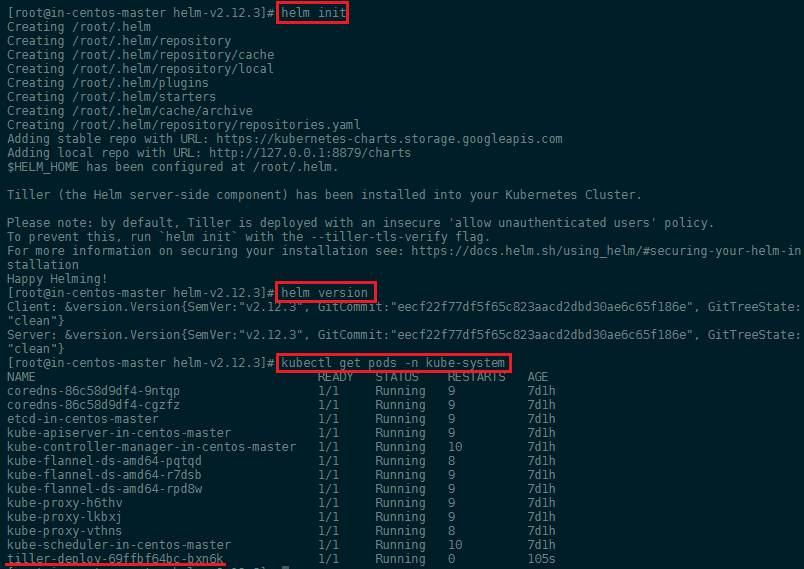
We can now type helm init to add the Tiller Pod to our cluster. You can verify that Helm is connected by running helm version (it should show your Helm client as well as Kubernetes version) and kubectl get pods -n kube-system:
Before we can install package, first run a helm repo update to make sure that you are up to date. And to allow Helm/Tiller to install packages to the default namespace in Kubernetes, we first have to run these three commands (optional - the installation below will create a custom namespace monitoring that is not going to cause any issues):
kubectl create serviceaccount --namespace kube-system tiller
kubectl create clusterrolebinding tiller-cluster-rule --clusterrole=cluster-admin --serviceaccount=kube-system:tiller
kubectl patch deploy --namespace kube-system tiller-deploy -p '{"spec":{"template":{"spec":{"serviceAccount":"tiller"}}}}'
Prometheus Installation
To install Prometheus we are going to use a repository by CoreOS called Prometheus Operator that provides easy monitoring definitions for Kubernetes services and deployment and management of Prometheus instances.
To install the chart with the release name test-release:
helm install --name test-release stable/prometheus-operator --namespace monitoring
helm install coreos/grafana --name my-release --set adminUser=bob
The command deploys prometheus-operator on the Kubernetes cluster in the default configuration. The configuration section lists the parameters that can be configured during installation.
The default installation includes Prometheus Operator, Alertmanager, Grafana, and configuration for scraping Kubernetes infrastructure.
To uninstall/delete the prometheus-operator deployment:
helm delete --purge test-release
kubectl delete crd prometheuses.monitoring.coreos.com
kubectl delete crd prometheusrules.monitoring.coreos.com
kubectl delete crd servicemonitors.monitoring.coreos.com
kubectl delete crd alertmanagers.monitoring.coreos.com
You can verify the successful installation with kubectl get all -n monitoring:
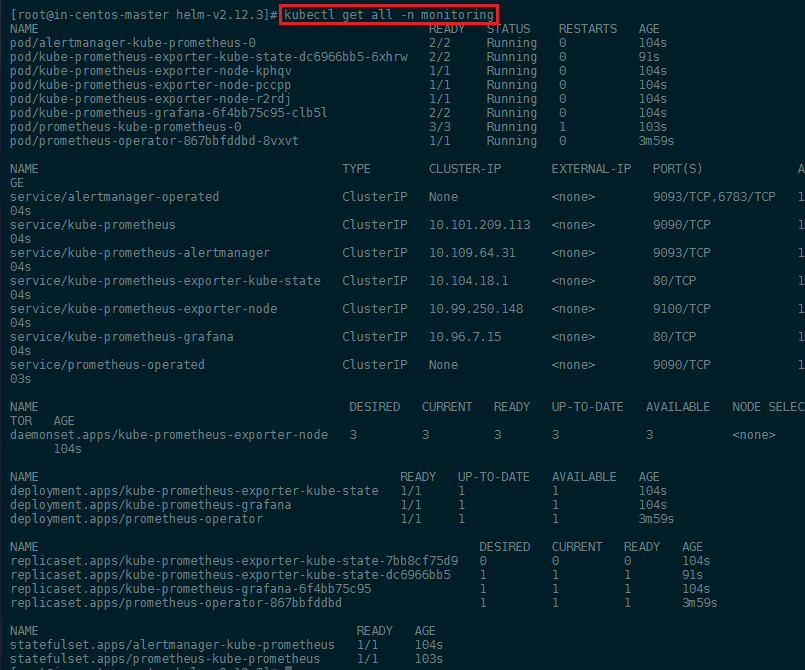
We can also verify that the Prometheus web interface is working - but as you can see above, the service kube-prometheus only has an internal port set (ClusterIP). We can edit this default configuration with:
kubectl edit svc kube-prometheus -n monitoring
This, by default will open the service configuration in Vim - you can install Nano and run export EDITOR=nano to prevent that from happening to you.
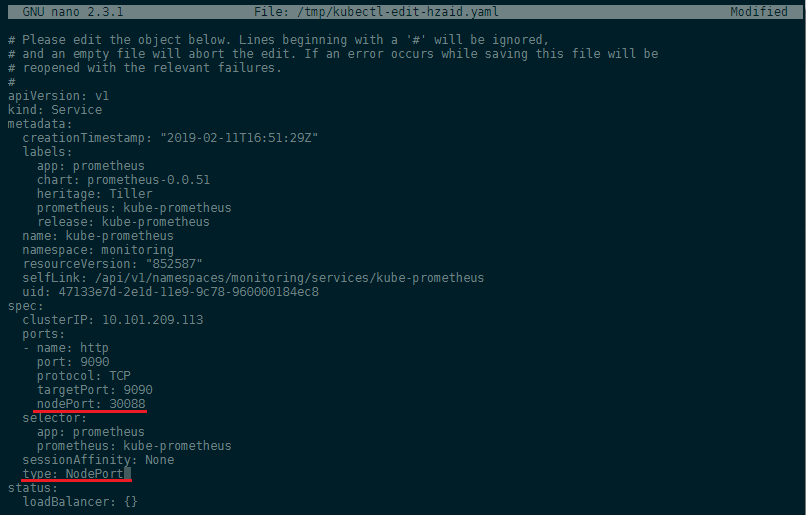
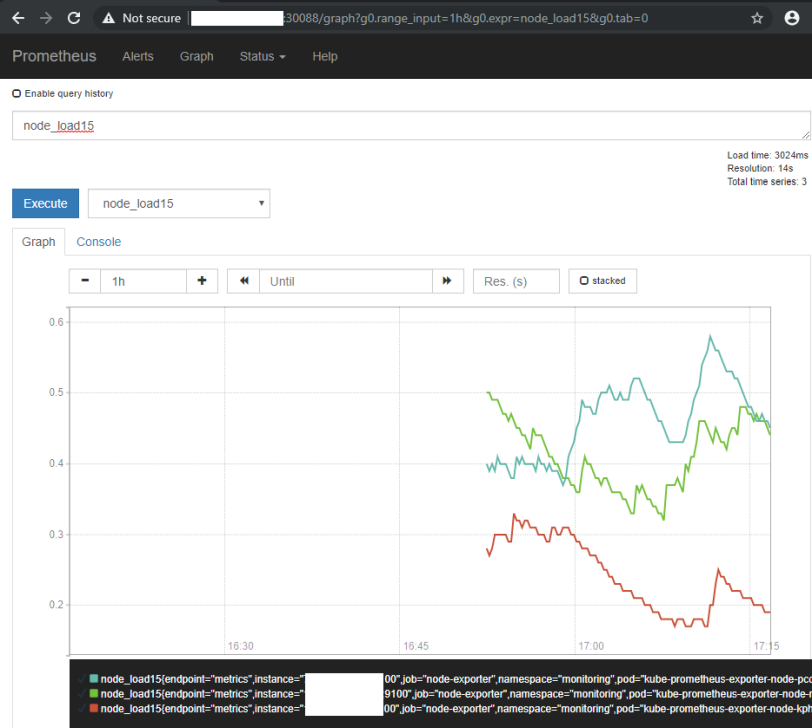
We added a nodePort: 30088 and set the type from ClusterIP to NodePort to expose the port for us. Saving the file will automatically verify your edit and re-apply the service configuration, if no error was found. You can access the web interface now by typing in your Master Server IP address followed by the port 30088:
But we are going to use Grafana as it offers a lot more as a frontend for Prometheus - I am going to revert the changes I made to service file to close the port 30088 again and let's use it for the Grafana service instead:
kubectl edit svc kube-prometheus-grafana -n monitoring
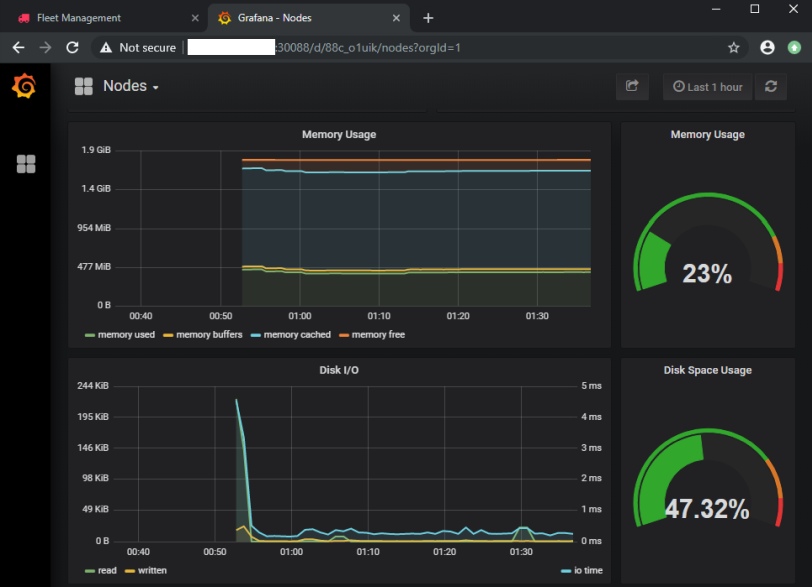
And you should now be greeted by the beautiful Grafana user interface:
The ELK Stack
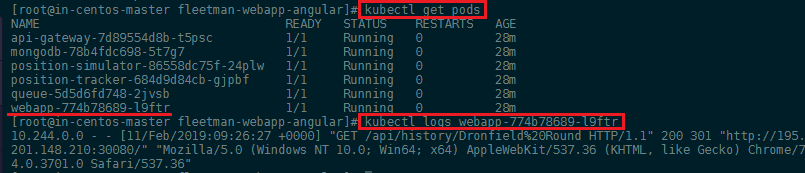
We build a Kubernetes cluster with a couple of micro services in the previous step and saw that we can get access to Kubernetes logs for each pod by first finding out it's name and then using the logs command:
kubectl get pods
kubectl logs webapp-774b78689-l9ftr
But it is really cumbersome to do when you have a large number of pods running. Also some information might be logged inside the container itself and are ephemeral in nature.
The most common solution for a distributed logging system is the ElasticStack - also called the ELK stack as it is traditionally build on three blocks:
We are going to switch Logstash with Fluentd. Fluentd is an open source data collector, which lets you unify the data collection and consumption for a better use and understanding of data. We are going to use it to connect to our pods, find active logs and collect them and offers a JSON structured downstream that we are going to feed into the Elasticsearch database. FluentD will have to be installed on every node inside our cluster - this is done by configuring it as a DaemonSet instead of a ReplicaSet.
Elasticsearch is a distributed, RESTful search and analytics engine and will be used to store the data collected by FluentD in a NoSQL fashion. The distributed nature of Elasticsearch allows us to easily combine one or more instances of the database into a cluster. It is recommended to have at least 2 instances running to ensure fail-over security. The Elasticsearch pod will also be created in a special kind of ReplicaSet called a StatefulSet. This ensures that the pods will not be assigned random names, but will always be called by their assigned pod name (elasticsearch-logging) followed by an incremental number -0, -1, etc - this is needed for pods that need to be clustered.
And last we have the Kibana frontend that lets you visualize the Elasticsearch data. So that hopefully we can extract some useful information from it - without having to sift through Gigabytes of hard to read Kubernetes logs. The frontend will only be used when we log in to check our logs. It is therefore sufficient to only run 1 instance as it is not a critical infrastructure.
Installation
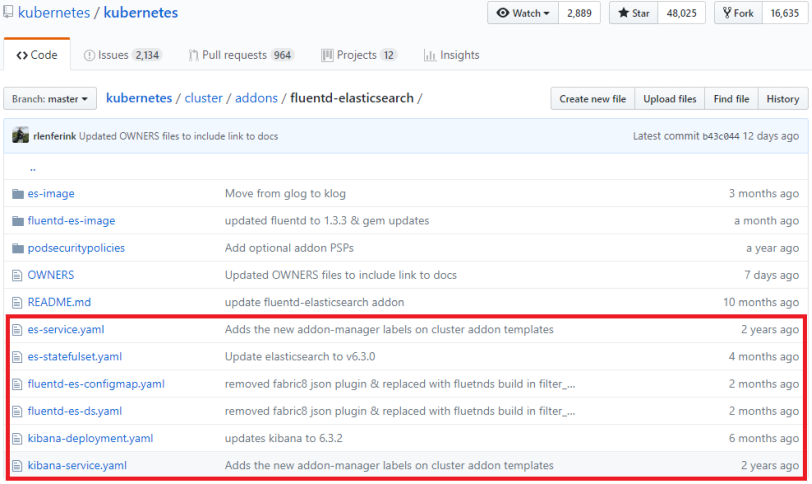
We are going to use a ready-2-go image from Kubernetes to install FluentD, Kibana and Elasticsearch. This repository contains both the YAML config files for Kubernetes as well as the information for build the required images for the three components. We only need to download the YAML files and download them to the directory where you stored the cluster configuration. When you downloaded all 6 files apply all of them to your cluster:
kubectl apply -f .
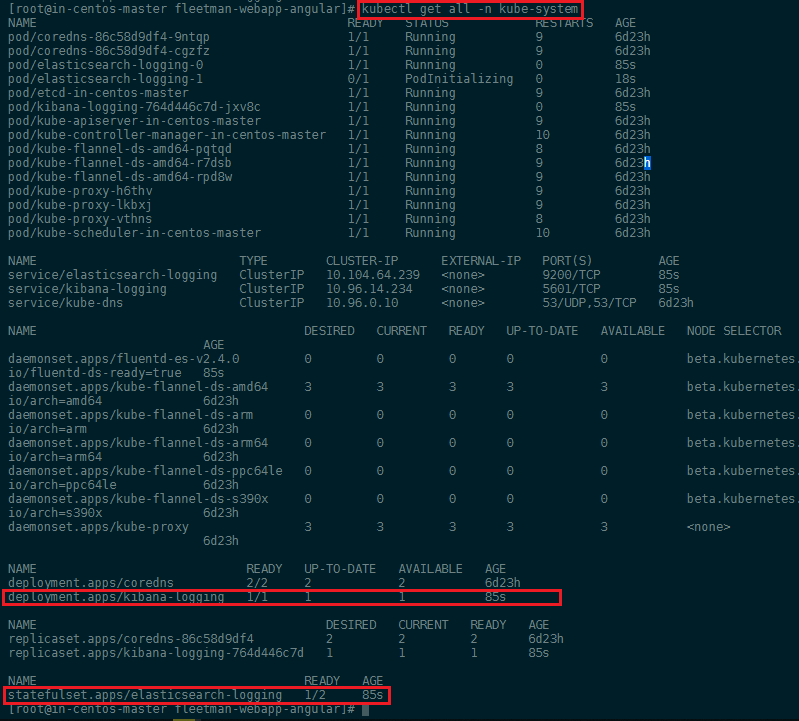
kubectl get all -n kube-system
TBC
https://github.com/helm/charts/tree/master/stable/elastic-stack
https://github.com/kiwigrid/helm-charts/tree/master/charts/fluentd-elasticsearch