Creating Node-RED Admin Panel using node-red-dashboard

Introduction
Before we look a how the chart node works, let's configure the inject node to send a timestamp every 5 seconds by setting the payload to timestamp and the repeat field to an interval of 5 seconds.
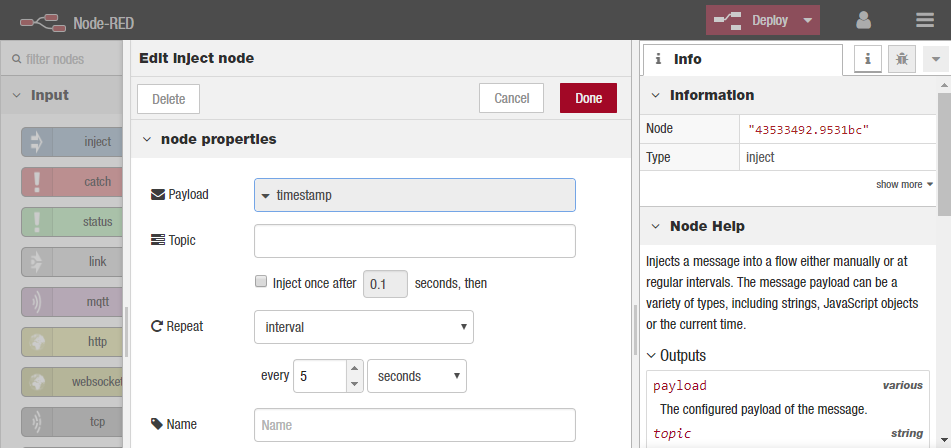
This will act as our repeating trigger. Now we need to set up the function node to generate a random number – we’ll use a simple JS math function to do this:
msg.payload = Math.round(Math.random()*100);
return msg;
Adding a Dashboard
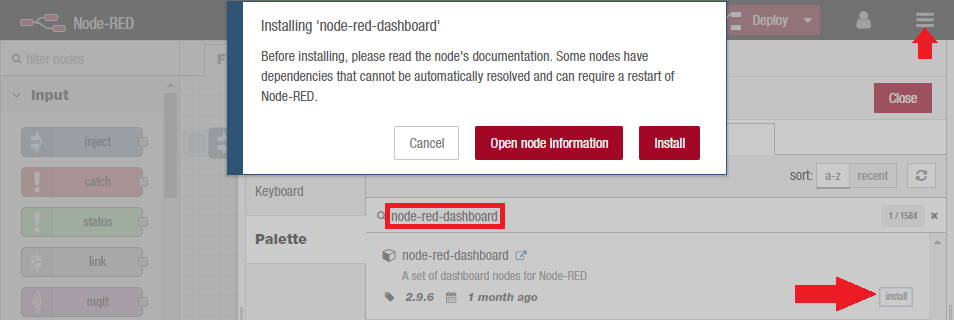
We now have a random number generator to simulate a sensor input - let's install node-red-dashboard to visualize the result. We can install the node by clicking the top-right hamburger menu, choosing Manage Palette and searching for node-red-dashboard:
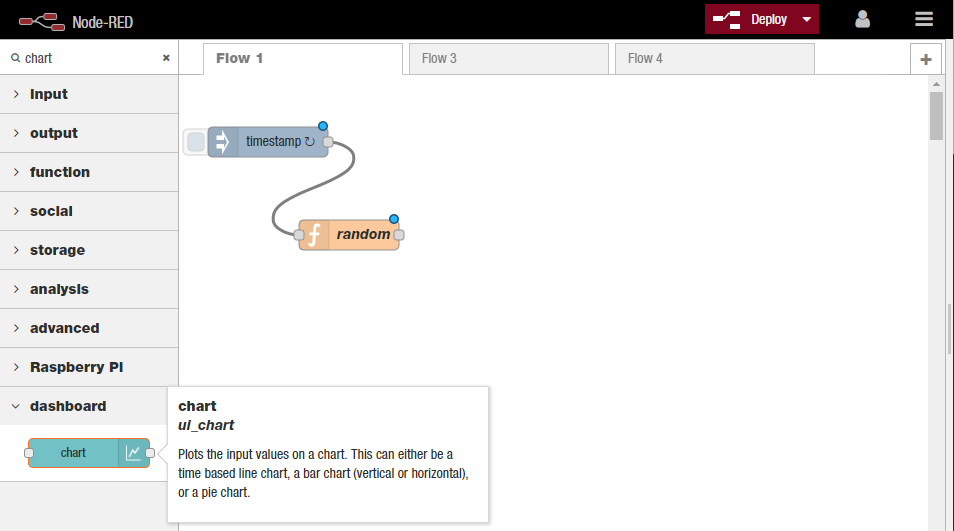
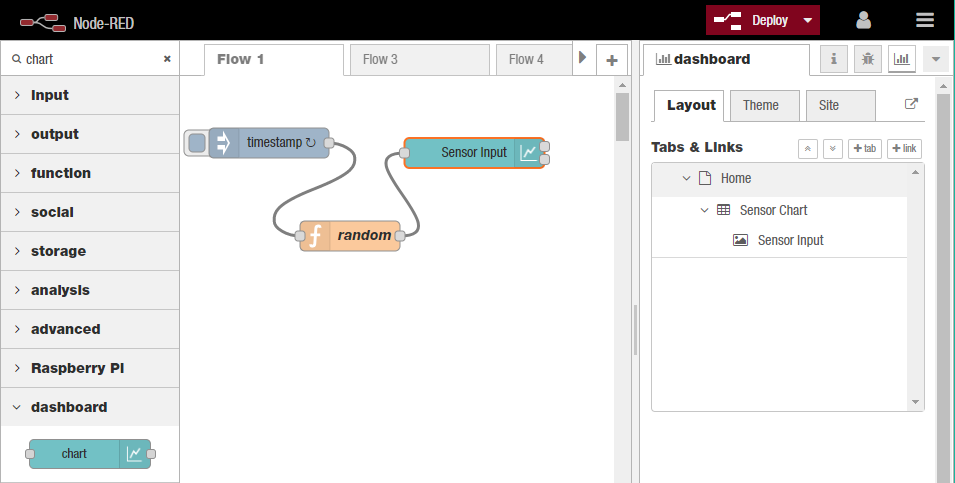
The chart node is now available to be added to our flow:
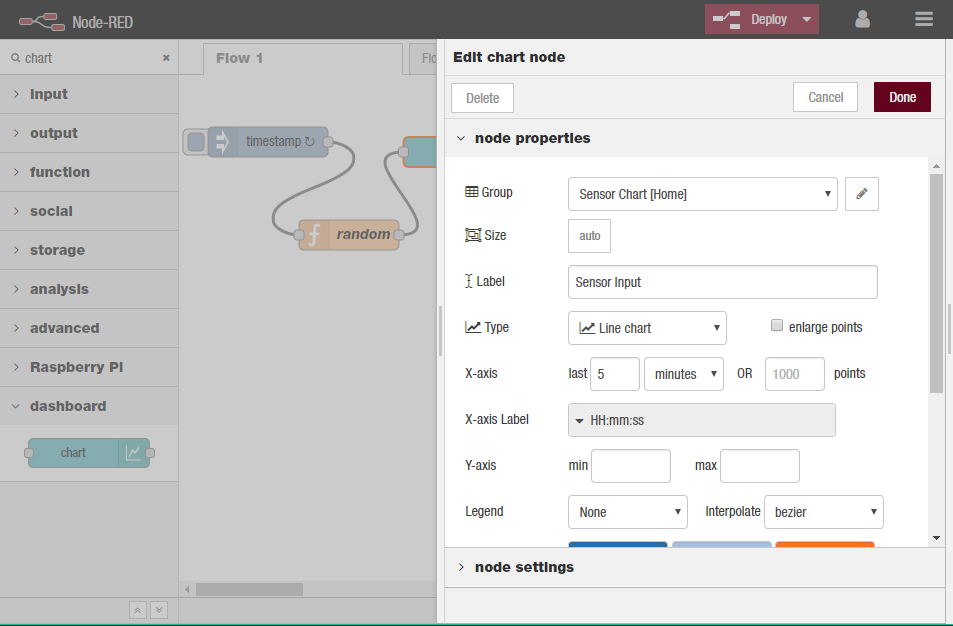
We can configure the chart node:
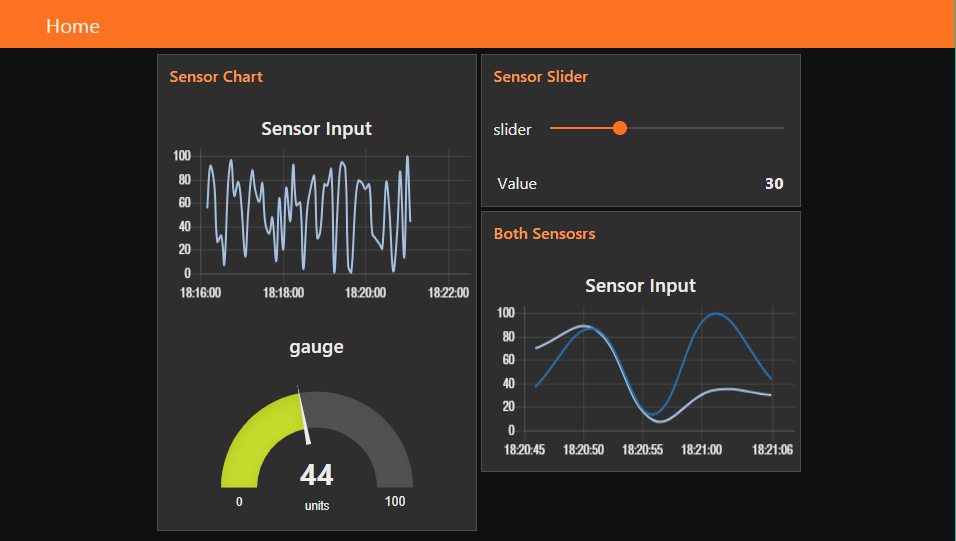
And access it via http://127.0.0.1:1880/ui/:
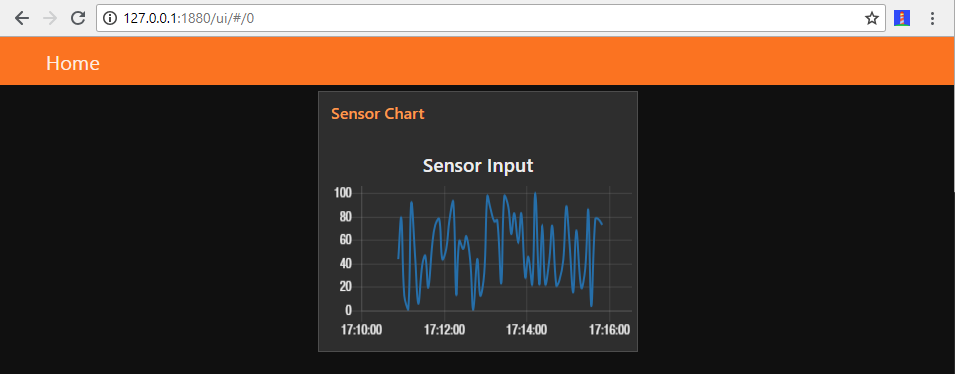
We added the Graph to the Home tab - you can use the dashboard settings to add more tabs or add more Groups to one tab:
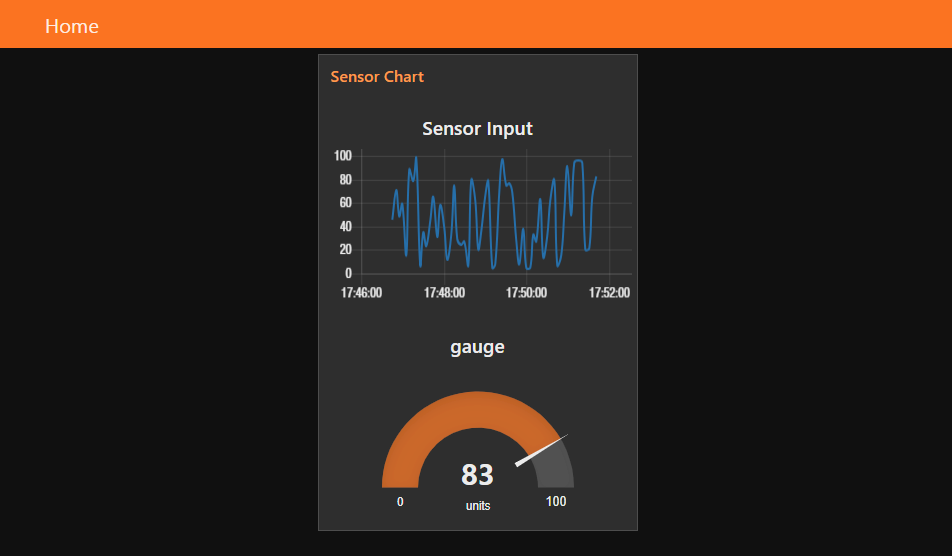
Let’s create a gauge to show the last data value sent. Drag a gauge node from the UI palette and wire it to the Random Number function node. Then double click to open up and let’s configure it:
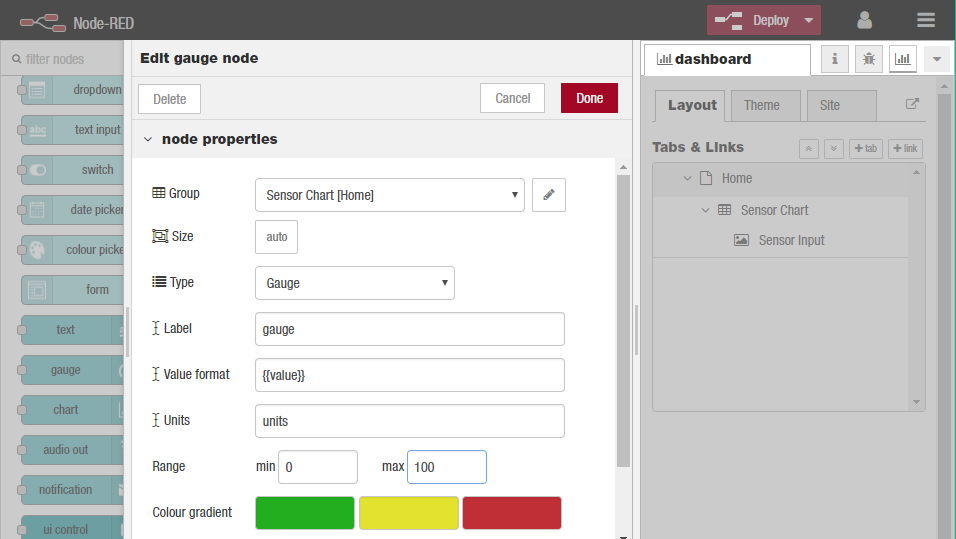
We’ll us the same Tab, home and we’ll also add it to the same group – “Sensor Chart[Home]”. The Min and Max fields allow you to set the min and max values the gauge will shown. Make sure the max is set to 100 which is the most that the random number function node will generate.
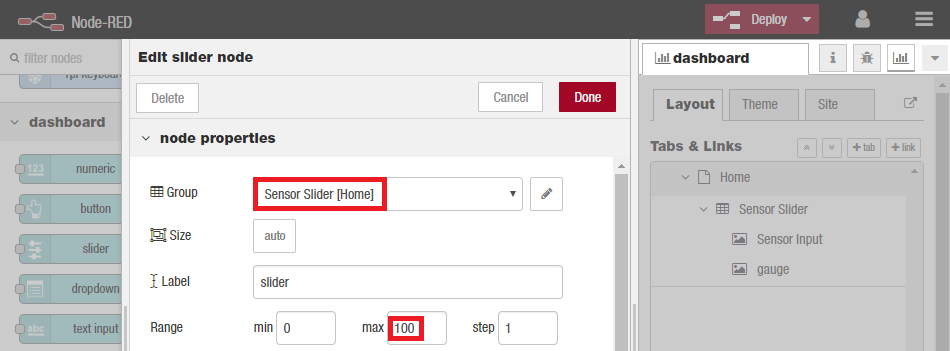
Let’s use a couple of the other UI nodes, a slider node and a text node to show the same data on a slider and as a text string. But this time we want to add them to separate group on the same Home tab:
Adding another Input
To simulate another Sensor Input, we can simply add another random number generator by editing our function node :
var msg = {};
var msg1 = {};

msg.payload = Math.round(Math.random()*100);
msg.topic = 'Line';

msg1.payload = Math.round(Math.random()*100);
msg1.topic = 'Line1';

return [msg, msg1];
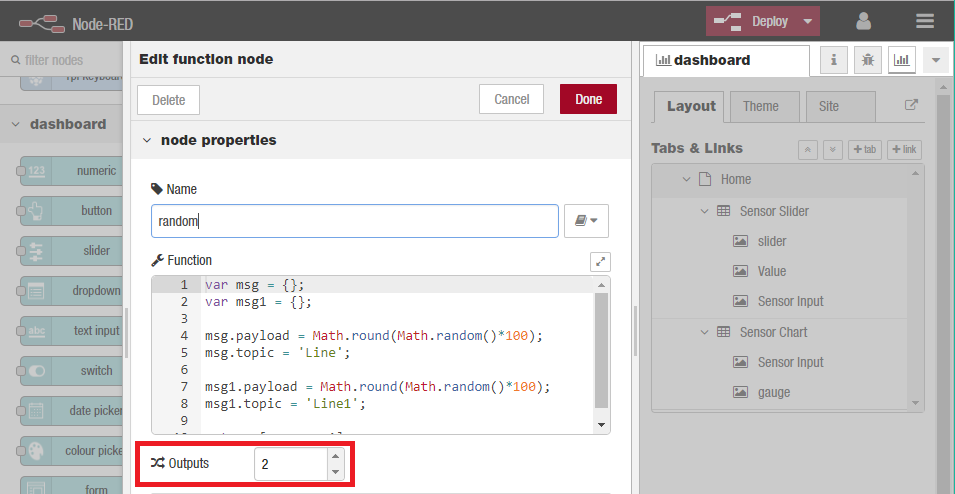
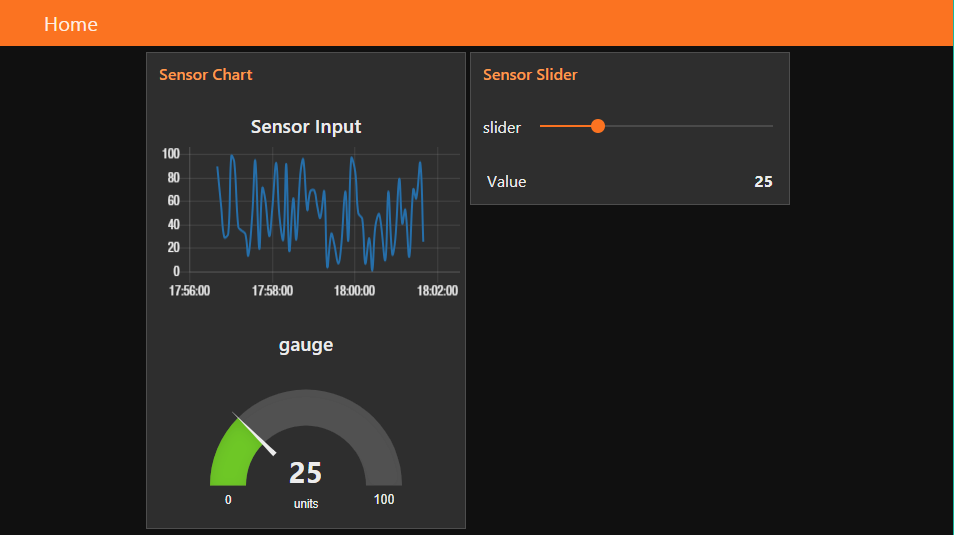
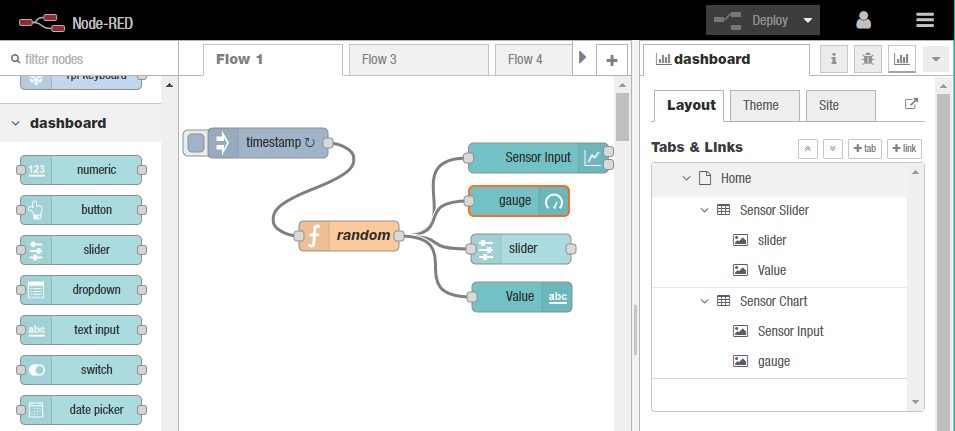
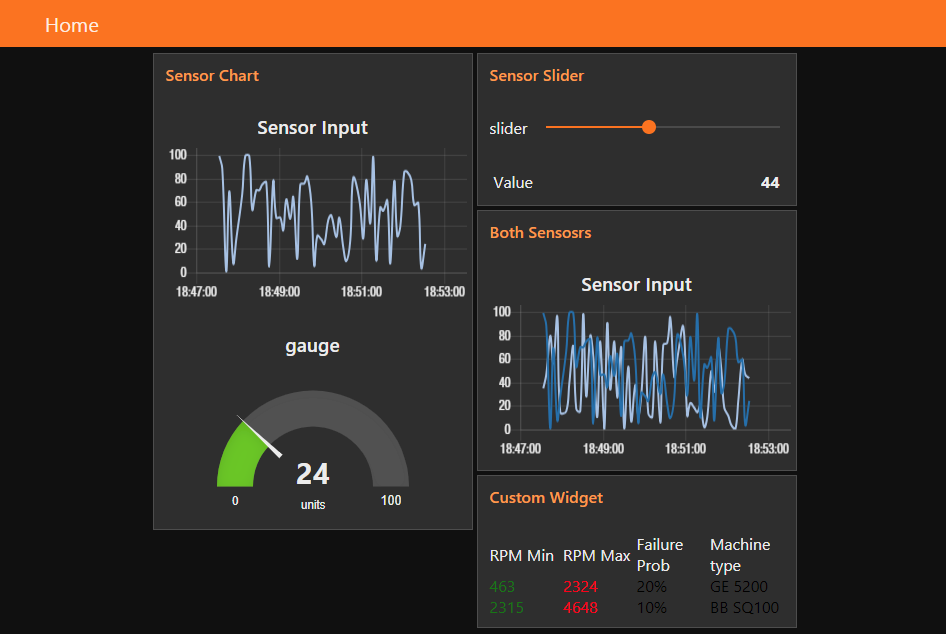
The function node now has 2 outputs - lets connect our graph and gauge node to the first and the slider and text node to the second. And create a second graph node in a new group that is fed both data sources:
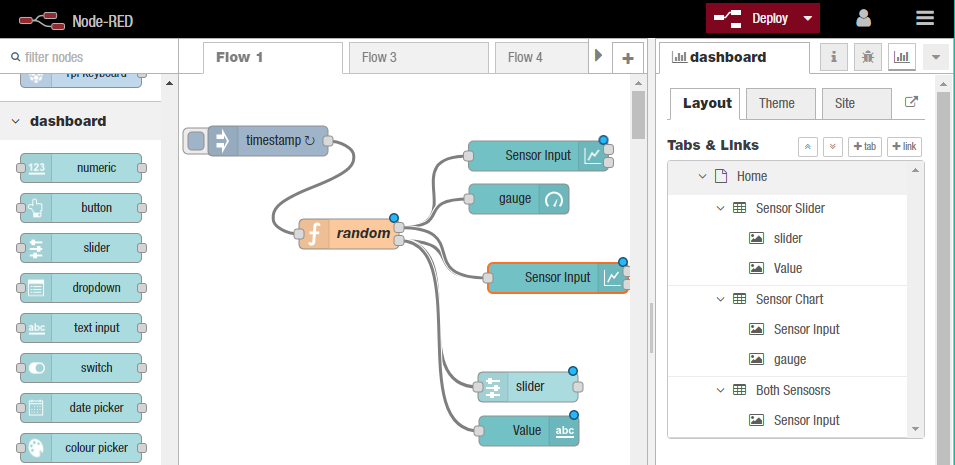
Et voilá!
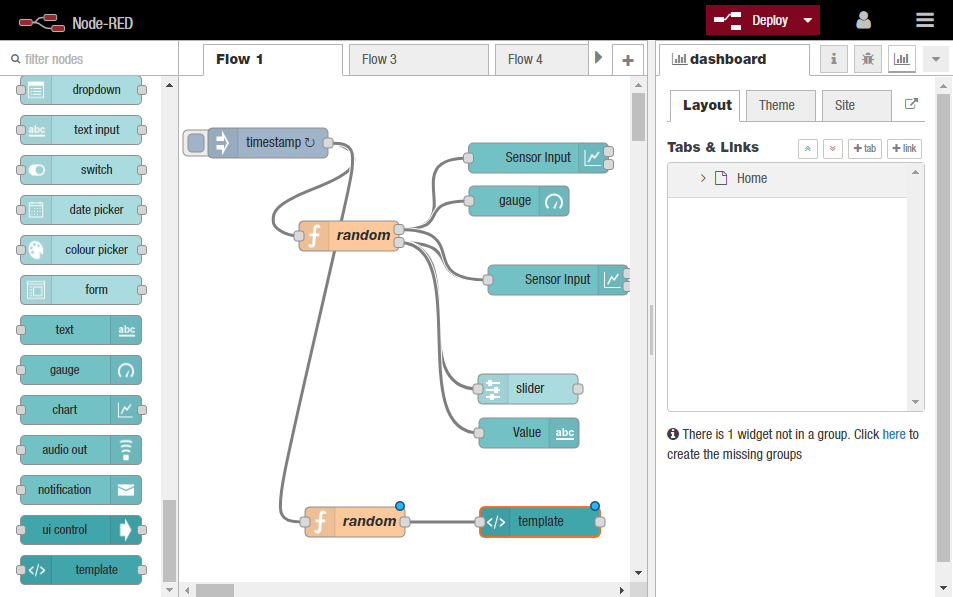
Adding a custom UI Widget
Let's clone our function node, connect the clone to the same timestamp inject node the original is connected to and change the random number generator as follows:
min = Math.round(Math.random()*1000);
max = Math.round((Math.random()*10000)+1000);

msg.payload = {
  factory: {
    machine00: {
      min: min,
      max: max,
      failProb: 20,
      name: "GE 5200"
    },
    machine01: {
      min: min*5,
      max: max*2,
      failProb: 10,
      name: "BB SQ100"
    }
  }
}

return msg;
We use the usual Math.random function to generate some fake data. However, instead of just passing this data in as payload, we insert the data into a JSON structure called factory. Factory has two elements -machine00 and machine01 which in turn have four elements min, max, failProb and name.
We now need to create a UI template node and set it up to display on our dashboard.
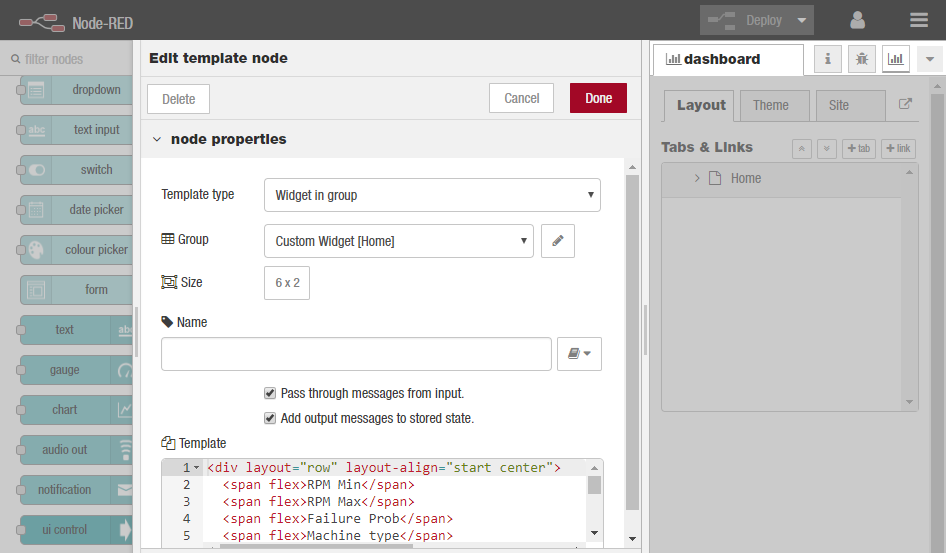
Add the following markup to the template node
<div layout="row" layout-align="start center">
  <span flex>RPM Min</span>
  <span flex>RPM Max</span>
  <span flex>Failure</span>
  <span flex>Type</span>
</div>
<div layout="row" layout-align="start center" ng-repeat="machine in msg.payload.factory">
  <span flex style="color: green">{{machine.min}}</span>
  <span flex style="color: red">{{machine.max}}</span>
  <span flex style="color: black">{{machine.failProb}}%</span>
  <span flex style="color: black">{{machine.name}}</span>
</div>
The first <div> sets out the labels for the columns defining them using the <span flex> tag so they will fit the space nicely. The second <div> then uses the ng-repeat command to iterate through the JSON structure in payload and display the data in the columns. Remember, we named each set of data associated with a machine, machine00, machine01 – so we iterate through those.
For each machine element, we use the sub-elements; min, max, failProb and name to fill the data fields. Note how we also use a style directive to set the colour for the text. The result is shown below.
Using external Libraries
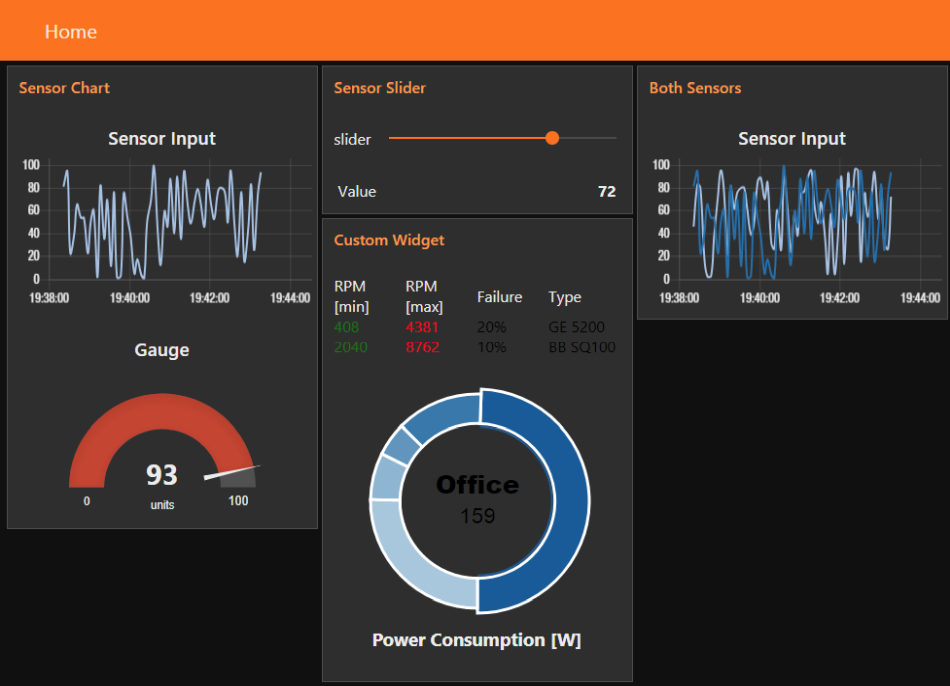
We want to build a custom widget using a 3rd party JavaScript charting library morris.js. For this example we'll use a donut chart since it's not available in the Node-RED dashboard widget set.
We’ll create a very simple flow for this example consisting of a timer to trigger action every 5 seconds, a function node to generate the fake data and the template node to display the data.
The function node is a simple as possible. It generates a random number and then uses that as a seed to calculate fake values for the different areas that consume power.
seed = Math.round(Math.random() * 1000);

msg.payload = {
  officeW: seed,
  storageW: seed / 4,
  conW: seed / 12,
  parkW:seed / 8,
  serverW: seed / 2
};

return msg;
The template node is a little more complex than previous examples because we are pulling in an external charting library (morris.js) and it’s dependencies and we are writing some JavaScript code to use the incoming data (from the function node) to draw the donut chart.
<link rel="stylesheet" href="https://cdnjs.cloudflare.com/ajax/libs/morris.js/0.5.1/morris.css">
 <script src="https://cdnjs.cloudflare.com/ajax/libs/raphael/2.1.0/raphael-min.js"></script>
 <script src="https://ajax.googleapis.com/ajax/libs/jquery/1.9.0/jquery.min.js"></script>
 <script src="https://cdnjs.cloudflare.com/ajax/libs/morris.js/0.5.1/morris.min.js"></script>

<div id="chart-example" style="height: 250px;"></div>

<h3 align="center">Power Consumption [W] </h3>

<script>

(function(scope) {
 var timer = setInterval(function() { //check that the Morris libs are loaded, if not wait
 if (!window.Morris) return;
 clearInterval(timer);

 var myData;

 var myDonut = Morris.Donut({
 element: 'chart-example',
 data: [
 {label: "Office", value: 1 },
 {label: "Storage", value: 1 },
 {label: "Confernce", value: 1 },
 {label: "Parking", value: 1 },
 {label: "Server", value: 1 }
 ]
 });

 scope.$watch('msg', function (msg) { //watch for an incoming NR msg
 if (msg) {

 myData = msg;
 myDonut.setData([
 {label: "Office", value: myData.payload.officeW },
 {label: "Storage", value: myData.payload.storageW },
 {label: "Confernce", value: myData.payload.conW },
 {label: "Parking", value: myData.payload.parkW },
 {label: "Server", value: myData.payload.serverW }
 ])
 };
 }); //close out the watch
 }, 100); // close out the setInterval
})(scope);


</script>
To update the donut chart, we want to look at the incoming Node-RED message, and use its payload to update the donut chart. To do this, we use a watch function to look for changes to the scope variable msg, which contains the incoming Node-RED message.
A good overview is available on the Angular docs page. Briefly, Angular implements a Model-View-Controller (MVC) in which the model (the data) is separate from the view (the DOM). Controllers (code), Expressions and Directives manipulate the data which dynamically updates the view (the Dom) so you see the changes. The model is managed in a structure referred to as the scope.
So coming back to our example, the code at line 37 tells the template node to look at the scope (all our data) and watch for changes to the variable msg. When msg changes, in this case because a new Node-RED message has arrived, the function then executes and simply extracts the new data from the msg.payload and uses it to call the setData() function on the Morris.Donut object (myDonut) which dynamically updates the donut chart.
All of the above is wrapped in a function which passes the scope so that it can be accessed using the watch method.
Export
[{"id":"aafc0f94.6fc66","type":"tab","label":"dashboard","disabled":false,"info":""},{"id":"43533492.9531bc","type":"inject","z":"aafc0f94.6fc66","name":"","topic":"","payload":"","payloadType":"date","repeat":"5","crontab":"","once":false,"onceDelay":0.1,"x":89,"y":67,"wires":[["48b6e9f0.d271a8","b9bbdc1.c9bbe2","cb239309.e7f31"]]},{"id":"48b6e9f0.d271a8","type":"function","z":"aafc0f94.6fc66","name":"random","func":"var msg = {};\nvar msg1 = {};\n\nmsg.payload = Math.round(Math.random()*100);\nmsg.topic = 'Line';\n\nmsg1.payload = Math.round(Math.random()*100);\nmsg1.topic = 'Line1';\n\nreturn [msg, msg1];","outputs":2,"noerr":0,"x":170,"y":160,"wires":[["68ff1fd1.ffce4","69a616b4.778708","9417dbf0.ced388"],["9417dbf0.ced388","8381759d.688758","942e1691.340b98"]]},{"id":"68ff1fd1.ffce4","type":"ui_chart","z":"aafc0f94.6fc66","name":"Sensor Input","group":"5f5d8461.9b6d0c","order":0,"width":0,"height":0,"label":"Sensor Input","chartType":"line","legend":"false","xformat":"HH:mm:ss","interpolate":"bezier","nodata":"Waiting for Data","dot":false,"ymin":"","ymax":"","removeOlder":"5","removeOlderPoints":"","removeOlderUnit":"60","cutout":0,"useOneColor":false,"colors":["#1f77b4","#aec7e8","#ff7f0e","#2ca02c","#98df8a","#d62728","#ff9896","#9467bd","#c5b0d5"],"useOldStyle":false,"x":359.5,"y":82,"wires":[[],[]]},{"id":"69a616b4.778708","type":"ui_gauge","z":"aafc0f94.6fc66","name":"","group":"5f5d8461.9b6d0c","order":0,"width":0,"height":0,"gtype":"gage","title":"Gauge","label":"units","format":"{{value}}","min":0,"max":"100","colors":["#00b500","#e6e600","#ca3838"],"seg1":"","seg2":"","x":340,"y":125,"wires":[]},{"id":"8381759d.688758","type":"ui_slider","z":"aafc0f94.6fc66","name":"","label":"slider","group":"a4cc4c7a.38c8d","order":0,"width":0,"height":0,"passthru":true,"topic":"","min":0,"max":"100","step":1,"x":349,"y":313,"wires":[[]]},{"id":"942e1691.340b98","type":"ui_text","z":"aafc0f94.6fc66","group":"a4cc4c7a.38c8d","order":0,"width":0,"height":0,"name":"","label":"Value","format":"{{msg.payload}}","layout":"row-spread","x":350,"y":357,"wires":[]},{"id":"9417dbf0.ced388","type":"ui_chart","z":"aafc0f94.6fc66","name":"Sensor Input","group":"89145363.61cc9","order":0,"width":0,"height":0,"label":"Sensor Input","chartType":"line","legend":"false","xformat":"HH:mm:ss","interpolate":"bezier","nodata":"Waiting for Data","dot":false,"ymin":"","ymax":"","removeOlder":"5","removeOlderPoints":"","removeOlderUnit":"60","cutout":0,"useOneColor":false,"colors":["#1f77b4","#aec7e8","#ff7f0e","#2ca02c","#98df8a","#d62728","#ff9896","#9467bd","#c5b0d5"],"useOldStyle":false,"x":379,"y":204,"wires":[[],[]]},{"id":"b9bbdc1.c9bbe2","type":"function","z":"aafc0f94.6fc66","name":"random","func":"min = Math.round(Math.random()*1000);\nmax = Math.round((Math.random()*10000)+1000);\n\nmsg.payload = {\n factory: {\n machine00: {\n min: min,\n max: max,\n failProb: 20,\n name: \"GE 5200\"\n },\n machine01: {\n min: min*5,\n max: max*2,\n failProb: 10,\n name: \"BB SQ100\"\n }\n }\n}\n\nreturn msg;","outputs":1,"noerr":0,"x":176,"y":446,"wires":[["61f38b83.ebb474"]]},{"id":"61f38b83.ebb474","type":"ui_template","z":"aafc0f94.6fc66","group":"7a9b7006.b60ac","name":"","order":0,"width":"6","height":"2","format":"<div layout=\"row\" layout-align=\"start center\">\n <span flex>RPM [min]</span>\n <span flex>RPM [max]</span>\n <span flex>Failure</span>\n <span flex>Type</span>\n <br/>\n</div>\n<div layout=\"row\" layout-align=\"start center\" ng-repeat=\"machine in msg.payload.factory\">\n <span flex style=\"color: green\">{{machine.min}}</span>\n <span flex style=\"color: red\">{{machine.max}}</span>\n <span flex style=\"color: black\">{{machine.failProb}}%</span>\n <span flex style=\"color: black\">{{machine.name}}</span>\n</div>","storeOutMessages":true,"fwdInMessages":true,"templateScope":"local","x":361,"y":446,"wires":[[]]},{"id":"cb239309.e7f31","type":"function","z":"aafc0f94.6fc66","name":"random","func":"seed = Math.round(Math.random() * 1000);\n\nmsg.payload = {\n officeW: seed,\n storageW: seed / 4,\n conW: seed / 12,\n parkW:seed / 8,\n serverW: seed / 2\n};\n\nreturn msg;","outputs":1,"noerr":0,"x":177,"y":516,"wires":[["d34891c8.a107c"]]},{"id":"d34891c8.a107c","type":"ui_template","z":"aafc0f94.6fc66","group":"7a9b7006.b60ac","name":"","order":0,"width":"6","height":"6","format":"<link rel=\"stylesheet\" href=\"https://cdnjs.cloudflare.com/ajax/libs/morris.js/0.5.1/morris.css\">\n <script src=\"https://cdnjs.cloudflare.com/ajax/libs/raphael/2.1.0/raphael-min.js\"></script>\n <script src=\"https://ajax.googleapis.com/ajax/libs/jquery/1.9.0/jquery.min.js\"></script>\n <script src=\"https://cdnjs.cloudflare.com/ajax/libs/morris.js/0.5.1/morris.min.js\"></script>\n\n<div id=\"chart-example\" style=\"height: 250px;\"></div>\n\n<h3 align=\"center\">Power Consumption [W] </h3>\n\n<script>\n\n(function(scope) {\n var timer = setInterval(function() { //check that the Morris libs are loaded, if not wait\n if (!window.Morris) return;\n clearInterval(timer);\n \n var myData;\n \n var myDonut = Morris.Donut({\n element: 'chart-example',\n data: [\n {label: \"Office\", value: 1 },\n {label: \"Storage\", value: 1 },\n {label: \"Confernce\", value: 1 },\n {label: \"Parking\", value: 1 },\n {label: \"Server\", value: 1 }\n ]\n });\n \n scope.$watch('msg', function (msg) { //watch for an incoming NR msg\n if (msg) {\n \n myData = msg;\n myDonut.setData([\n {label: \"Office\", value: myData.payload.officeW },\n {label: \"Storage\", value: myData.payload.storageW },\n {label: \"Confernce\", value: myData.payload.conW },\n {label: \"Parking\", value: myData.payload.parkW },\n {label: \"Server\", value: myData.payload.serverW }\n ])\n };\n }); //close out the watch \n }, 100); // close out the setInterval \n})(scope);\n\n\n</script>","storeOutMessages":true,"fwdInMessages":true,"templateScope":"local","x":363,"y":517,"wires":[[]]},{"id":"5f5d8461.9b6d0c","type":"ui_group","z":"","name":"Sensor Chart","tab":"e98cb2c4.c173b","order":1,"disp":true,"width":"6","collapse":false},{"id":"a4cc4c7a.38c8d","type":"ui_group","z":"","name":"Sensor Slider","tab":"e98cb2c4.c173b","order":2,"disp":true,"width":"6","collapse":false},{"id":"89145363.61cc9","type":"ui_group","z":"","name":"Both Sensors","tab":"e98cb2c4.c173b","order":3,"disp":true,"width":"6","collapse":false},{"id":"7a9b7006.b60ac","type":"ui_group","z":"","name":"Custom Widget","tab":"e98cb2c4.c173b","order":4,"disp":true,"width":"6","collapse":false},{"id":"e98cb2c4.c173b","type":"ui_tab","z":"","name":"Home","icon":"dashboard"}]