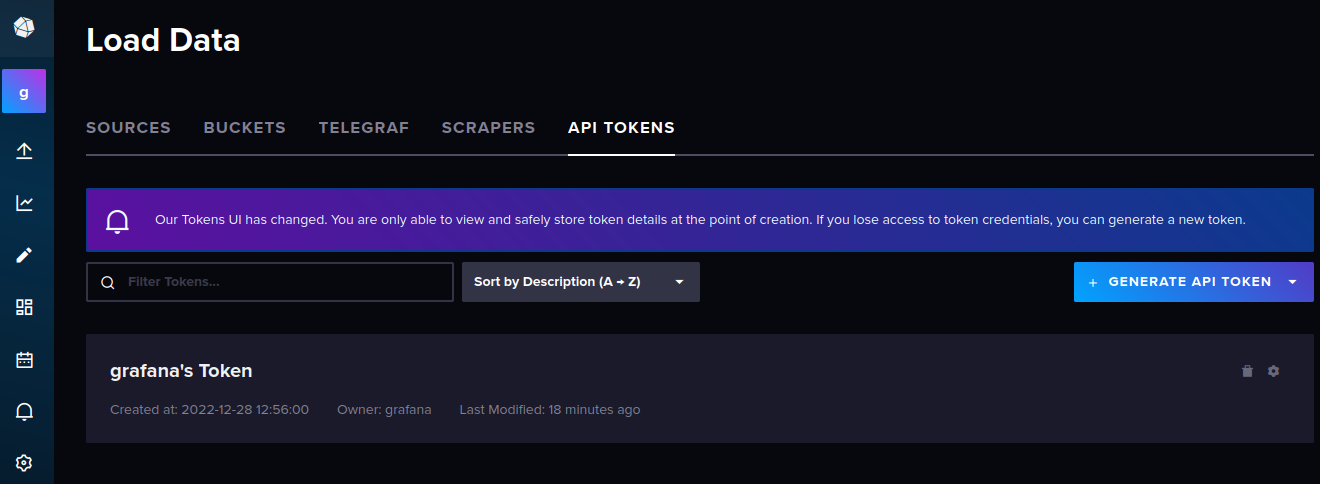
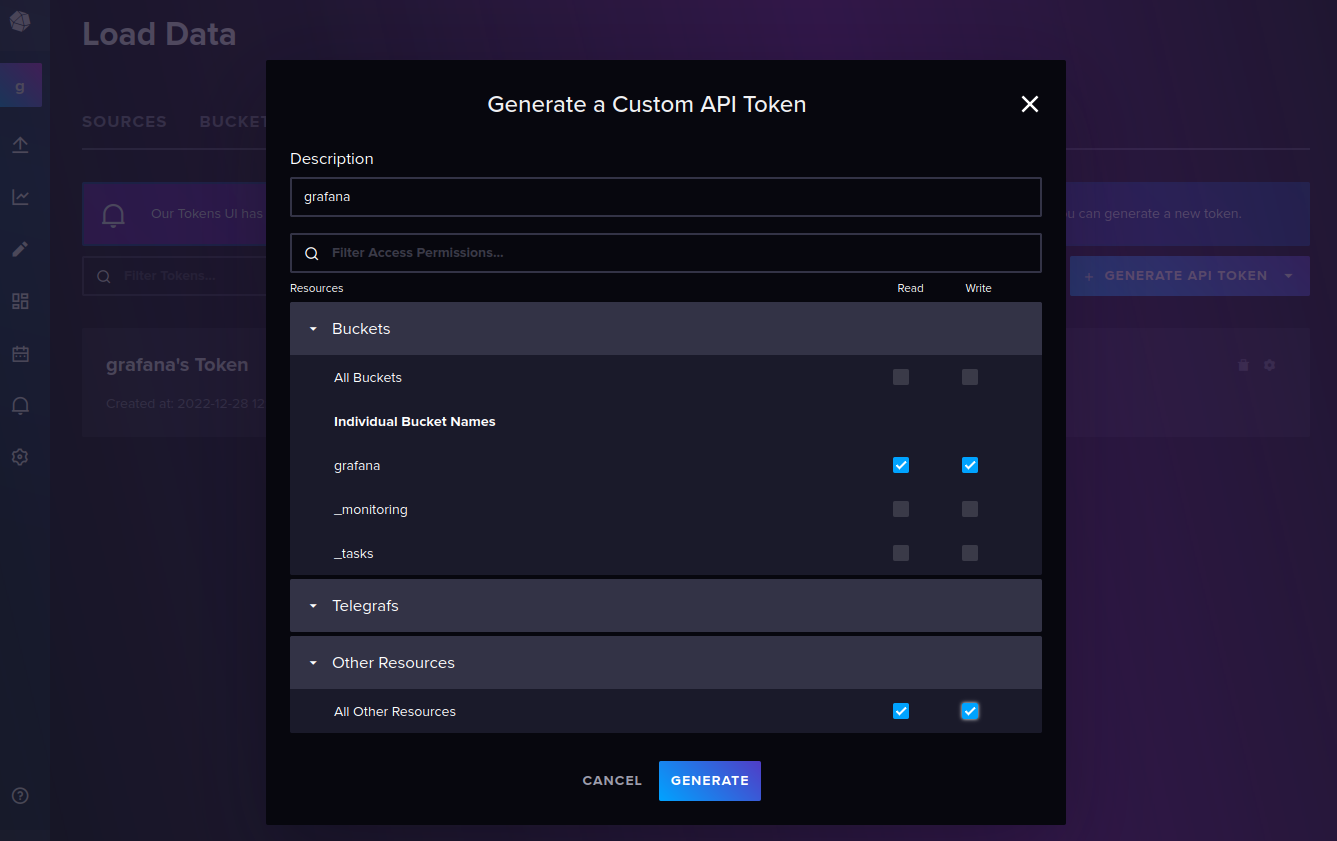
Grafana IoT Dashboard

Configuration
/etc/grafana/grafana.ini (see full example):
app_mode = production
data = /var/lib/grafana
temp_data_lifetime = 24h
logs = /var/log/grafana
plugins = /var/lib/grafana/plugins
provisioning = conf/provisioning
protocol = http
http_port = 3000
reporting_enabled = false
allow_sign_up = false
default_theme = dark
full_date = YYYY-MM-DD HH:mm:ss
interval_second = HH:mm:ss
interval_minute = HH:mm
interval_hour = MM/DD HH:mm
interval_day = MM/DD
interval_month = YYYY-MM
interval_year = YYYY
use_browser_locale = false
Installation with Docker-Compose
We can mount this configuration file into a Grafana container by running docker-compose up -d on the following file:
version: '3'

services:

  grafana:
    image: grafana/grafana-oss:latest
    container_name: grafana
    ports:
      - 3000:3000
    environment:
      - GF_SECURITY_ADMIN_USER=admin
      - GF_SECURITY_ADMIN_PASSWORD=instar
    volumes:
      - type: bind
        source: ./grafana.ini
        target: /etc/grafana/grafana.ini
        read_only: true
      - type: volume
        source: grafanavol
        target: /var/lib/grafana
    networks:
      - grafana

volumes:
  grafanavol:

networks:
  grafana:
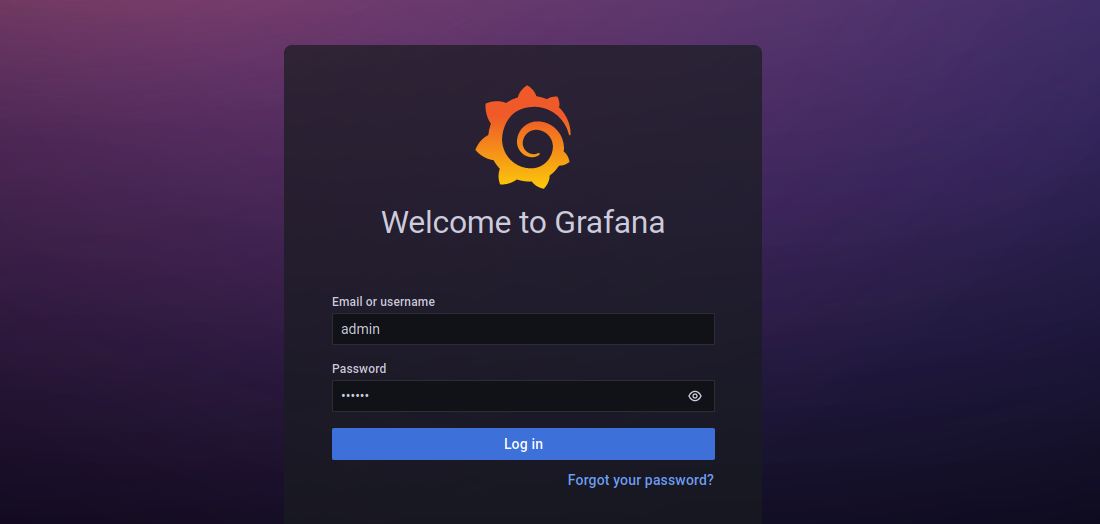
Visit localhost:3000 and login with the user name and password set as environment variables above:
Datasources
Infinity Plugin
The Grafana Infinity Datasource allows you to visualize data from JSON, CSV, XML, GraphQL and HTML endpoints. It can be installed from the Plugins directory:
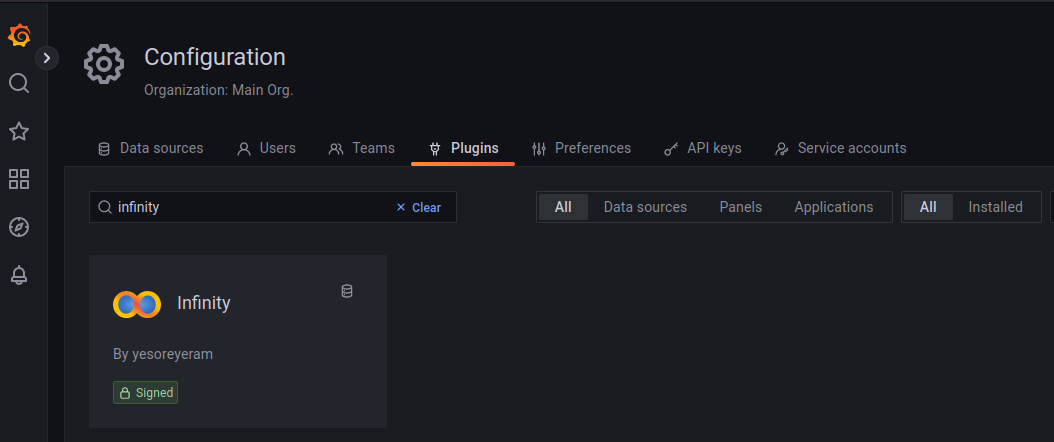
Go to Configuration / Data sources and click on Add data source:

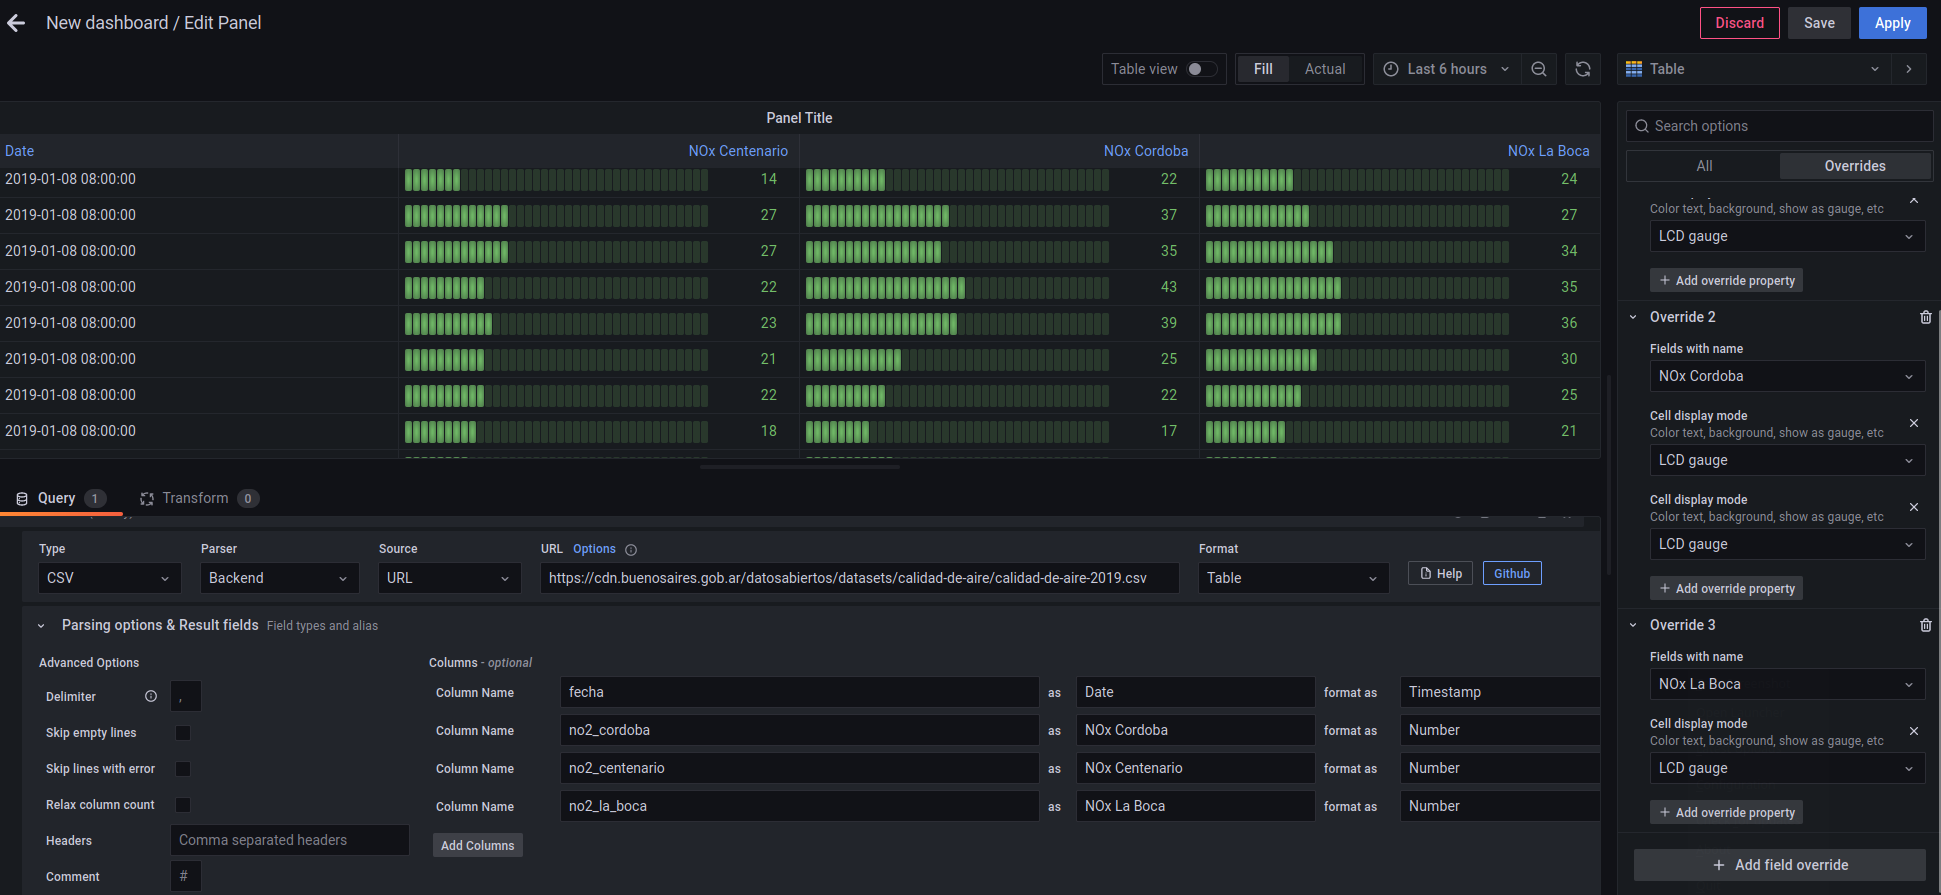
The Plugin can now be used to load external data sources, e.g. CSV files for the Air Quality in Buenos Aires 2019. Here we can see the NO2 and PM10 measurements for three different areas:

That can be turned into a visualization on a dashboard:
Time Series Databases
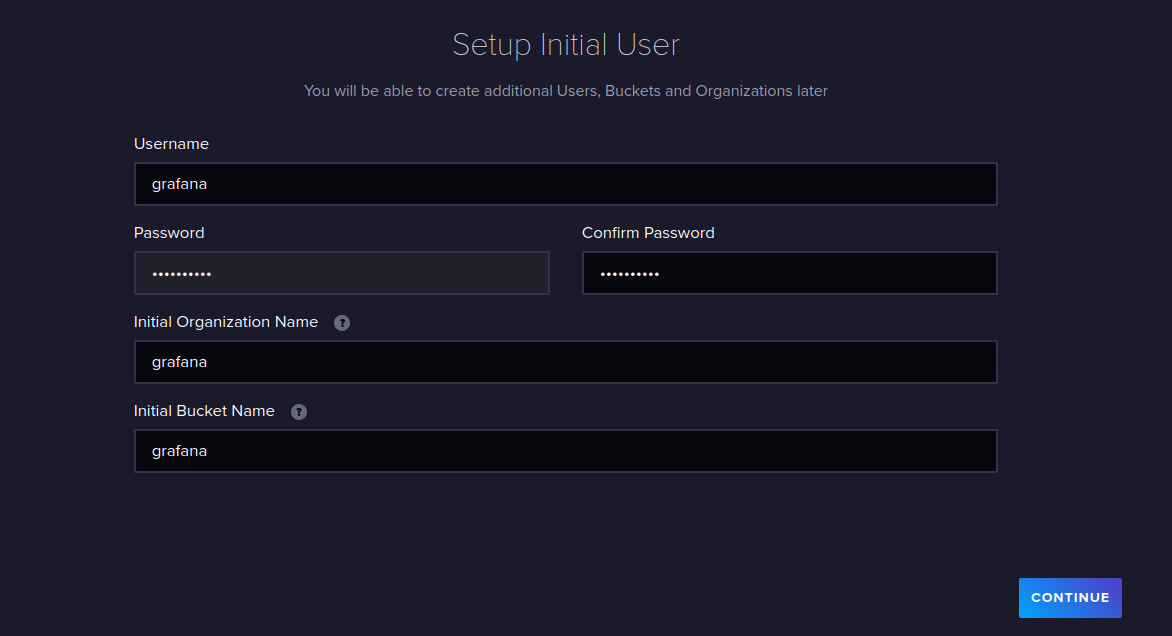
The default TSDB for Grafana is InfluxDB which we can quickly add to our Docker-Compose file together with Chronograf - the official database frontend:
version: '3'

services:

  grafana:
    image: grafana/grafana-oss:latest
    container_name: grafana
    ports:
      - 3000:3000
    environment:
      - GF_SECURITY_ADMIN_USER=${GRAFANA_USER}
      - GF_SECURITY_ADMIN_PASSWORD=${GRAFANA_PASSWORD}
    volumes:
      - type: bind
        source: ./grafana.ini
        target: /etc/grafana/grafana.ini
        read_only: true
      - type: volume
        source: grafanavol
        target: /var/lib/grafana
    depends_on:
      - influxdb
    networks:
      - grafana

  chronograf:
    image: chronograf:latest
    ports:
      - '127.0.0.1:8888:8888'
    volumes:
      - chronovol:/var/lib/chronograf
    depends_on:
      - influxdb
    environment:
      - INFLUXDB_URL=http://influxdb:8086
      - INFLUXDB_USERNAME=${INFLUXDB_USERNAME}
      - INFLUXDB_PASSWORD=${INFLUXDB_PASSWORD}
    networks:
      - grafana

  influxdb:
    image: influxdb:latest
    ports:
      - '8086:8086'
    volumes:
      - influxvol:/var/lib/influxdb
    environment:
      - INFLUXDB_DB=db0
      - INFLUXDB_ADMIN_USER=${INFLUXDB_USERNAME}
      - INFLUXDB_ADMIN_PASSWORD=${INFLUXDB_PASSWORD}
    networks:
      - grafana

volumes:
  grafanavol:
  influxvol:
  chronovol:

networks:
  grafana:
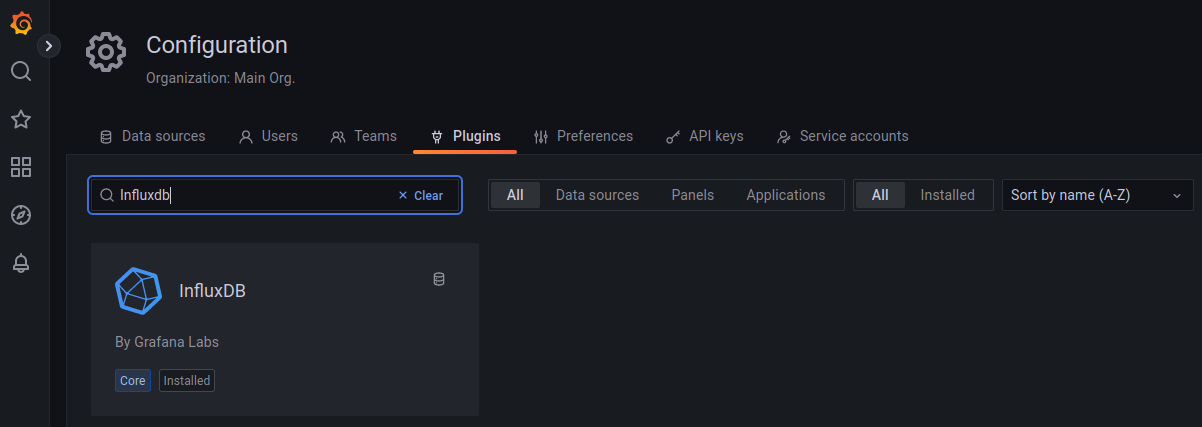
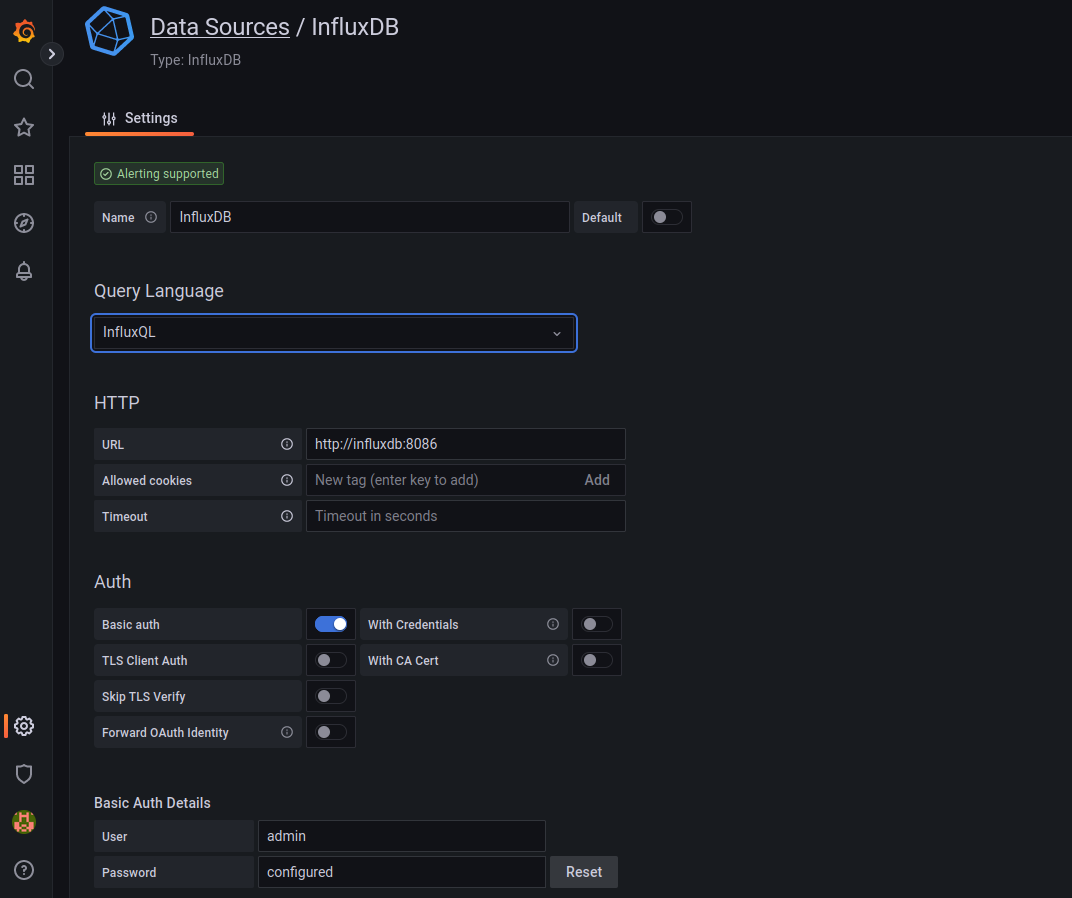
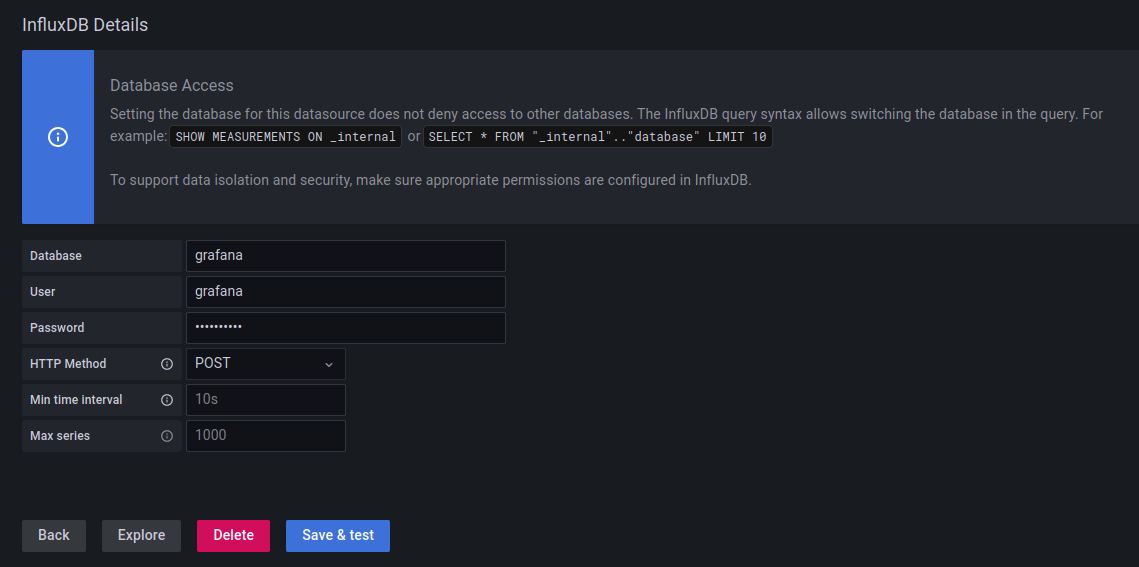
Connecting Grafana to InfluxDB
