Zabbix Monitoring a Website

Page Availability Check
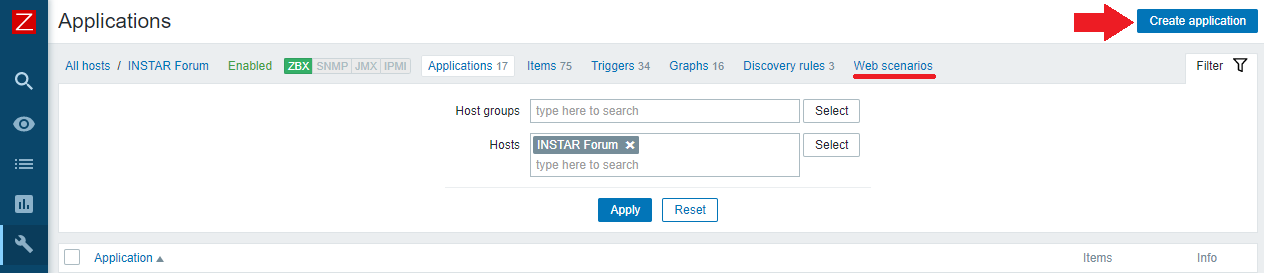
On the dashboard screen, access the Configuration menu and select the Host option. On the Host properties screen, access the Applications tab. On the top right part of the screen, click on the Create application button and name the application according to the website you want to monitor, e.g. INSTAR Forum Website Monitor:
Back on the Application Screen on the top right, click on the Web Scenarios link and then the Create Web Scenario button. On the web scenario screen, you need to configure the following items:
- Name: Enter a website identification.
- Application: Choose the application you created before, e.g.
INSTAR Forum Website Monitor. - Update interval: 1 Minute
- Agent: Zabbix
- Enabled: Yes
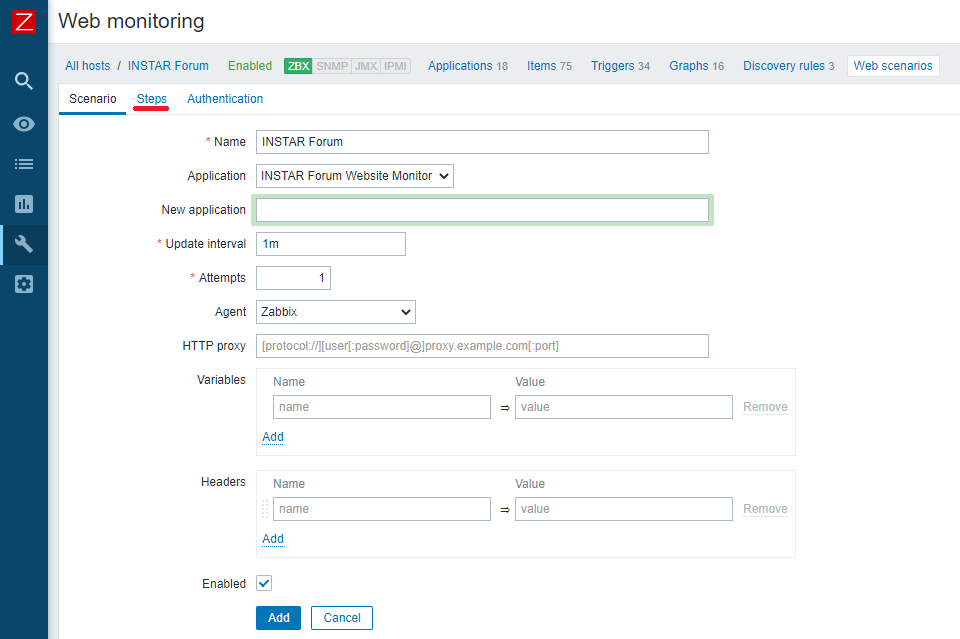
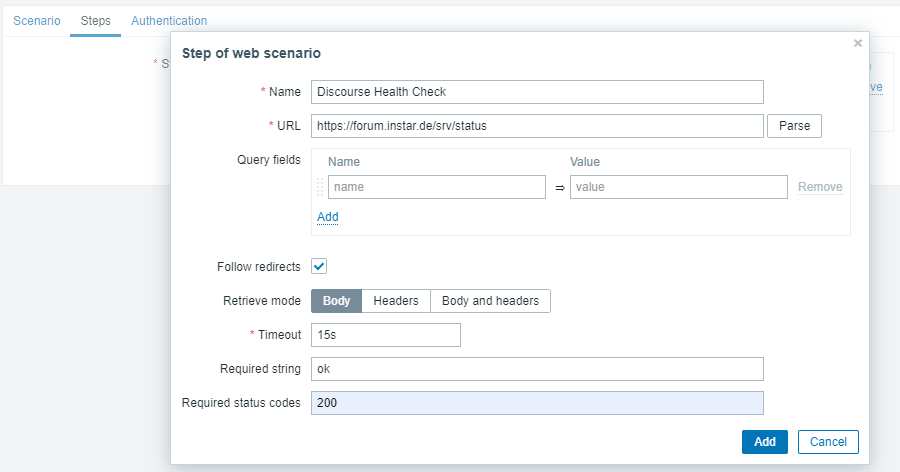
Access the Steps tab to add a new step and configure the following items:
- Name: Enter an identification.
- URL: Enter the website URL
- Follow redirects: Yes
- Retrieve mode: Headers
- Require status code: 200
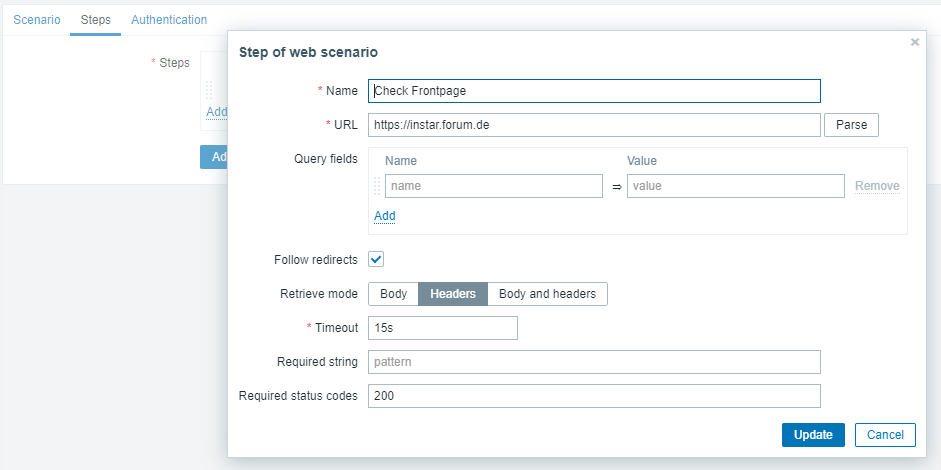
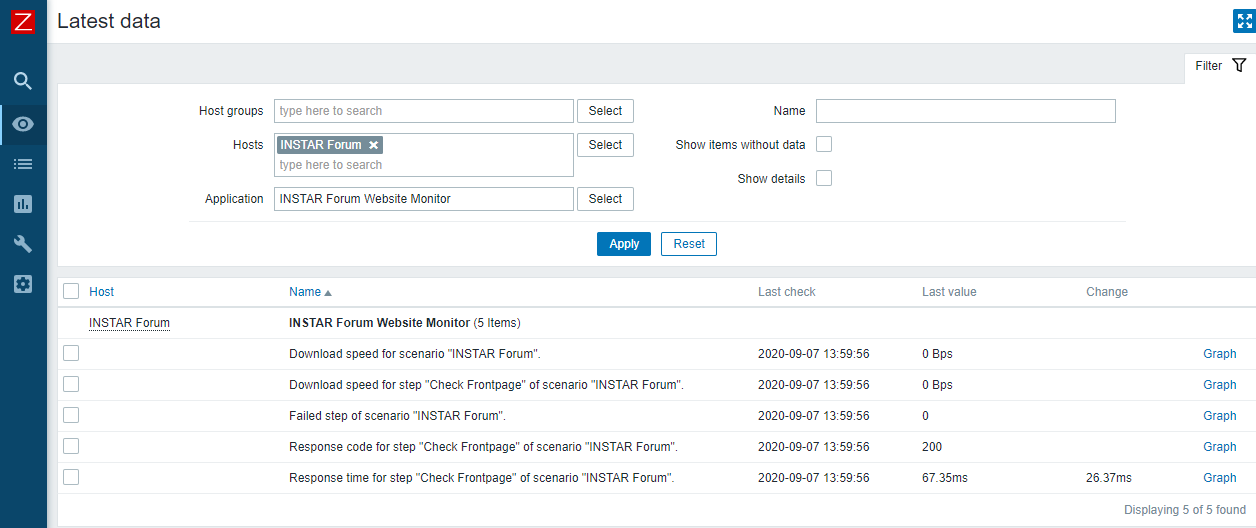
Click on the Add button to finish the web scenario configuration and wait 5 minutes. In order to test your configuration, access the Monitoring menu, click on the Latest data and filter for your server and application:
Login Check
Frontend Login
Go to Configuration → Hosts, pick a host and click on Web in the row of that host. Then click on Create web scenario.
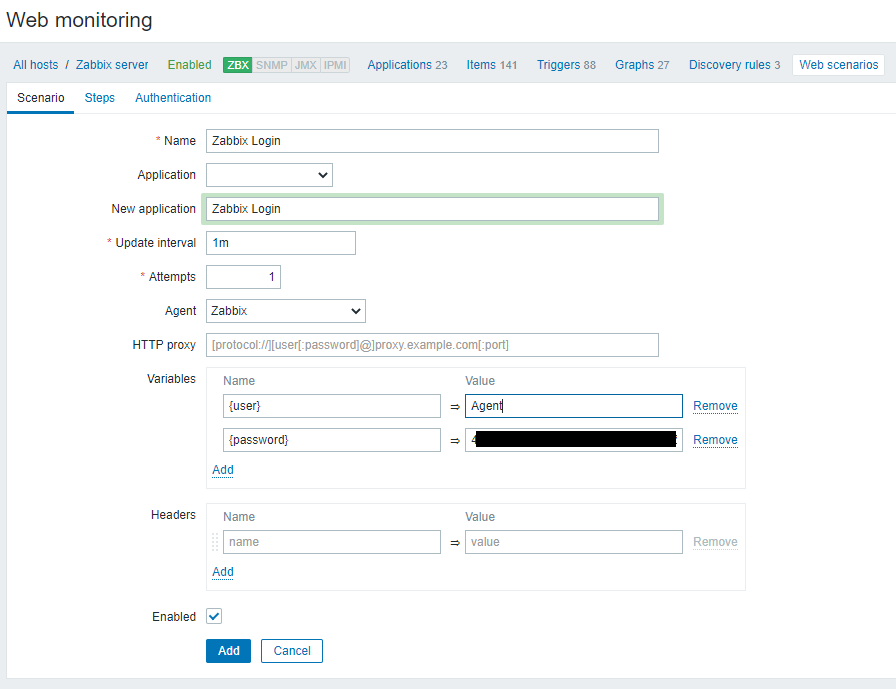
In the new scenario form we will name the scenario as Zabbix Login and create a new Zabbix Login application for it. Note that we will also create two variables: {user} and {password}.
Now we can define steps for the scenario. Click on Add button in the Steps tab to add individual steps. We start by checking that the first page responds correctly, returns with HTTP response code 200 and contains text Zabbix SIA:
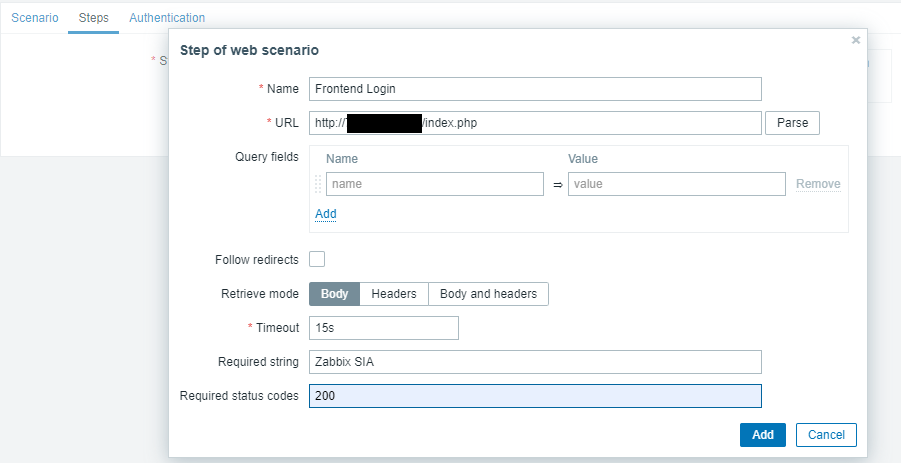
When done configuring the step, click on Add. You can check if the service is running and receiving the correct HTTP response code:
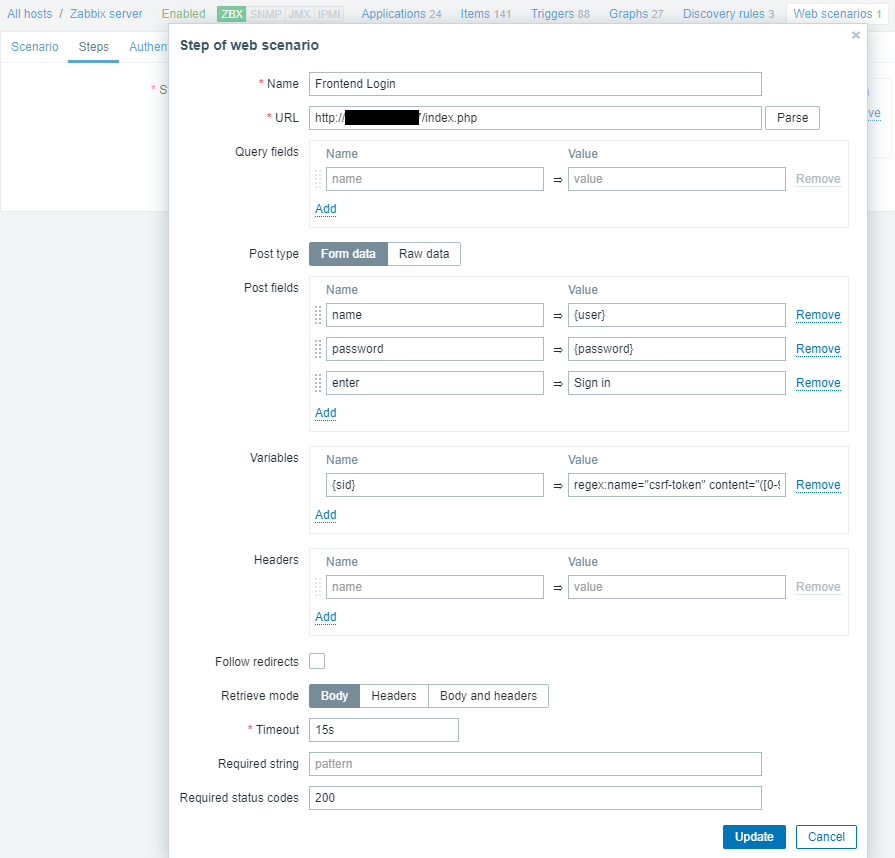
We continue by logging in to the Zabbix frontend, and we do so by reusing the variables we defined on the scenario level - {user} and {password}. Take note also of how we are getting the content of the {sid} variable (session ID) using a variable syntax with regular expression regex:name="csrf-token" content="([0-9a-z]{16})":
Verifying that Content is available
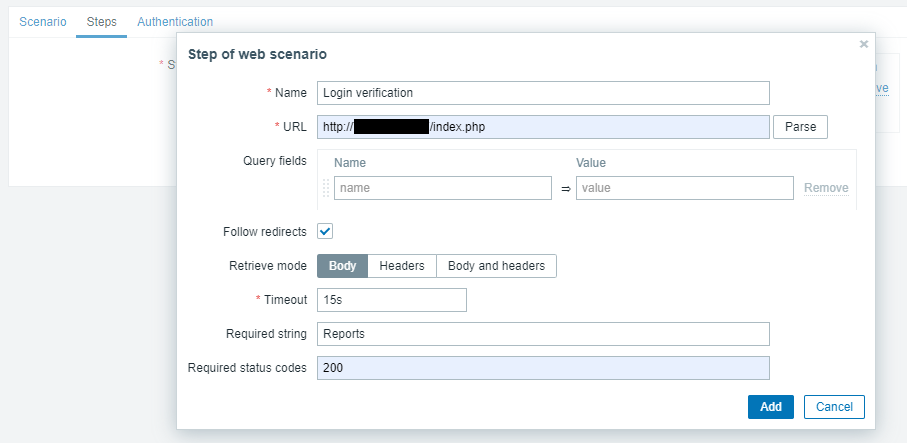
Being logged in, we should now verify a string, that is only visible when logged in, is available to our user - for example, Reports. We can do this by adding another step to our scenario:
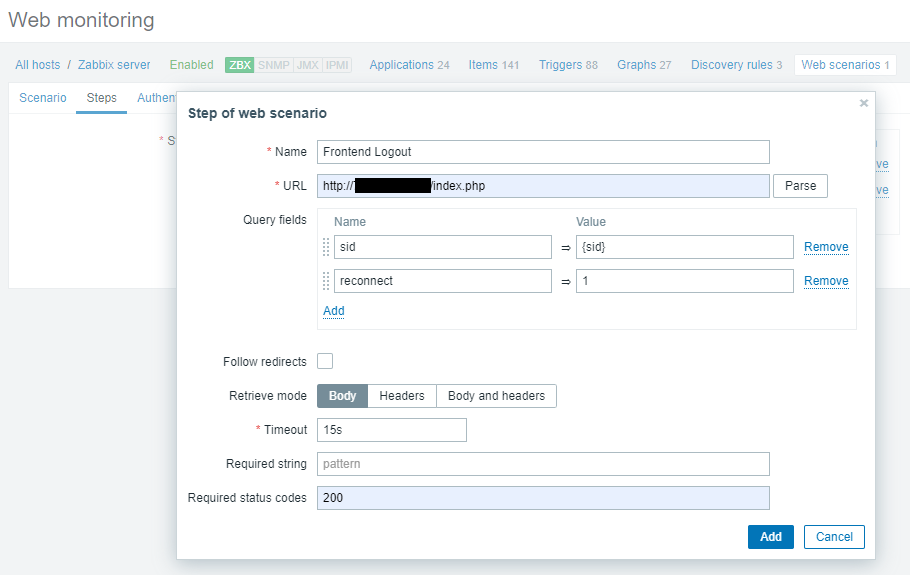
Now that we have verified that frontend is accessible and we can log in and retrieve logged-in content, we should also log out - otherwise Zabbix database will become polluted with lots and lots of open session records:
We can also check that we successfully logged out by looking for the Username string:

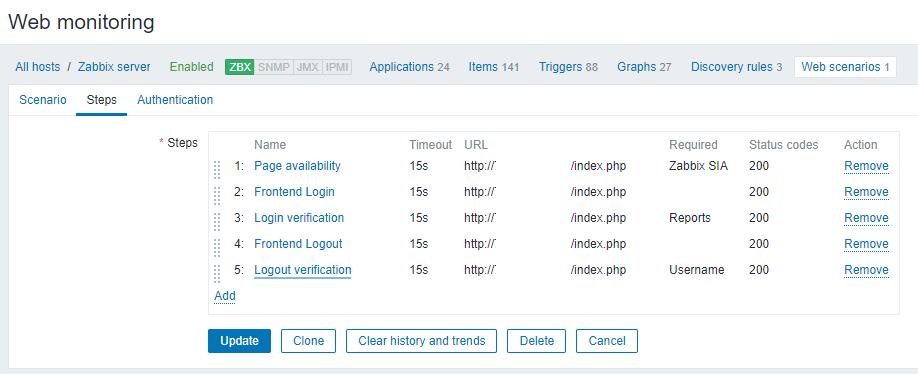
A complete configuration of web scenario steps should look like this:
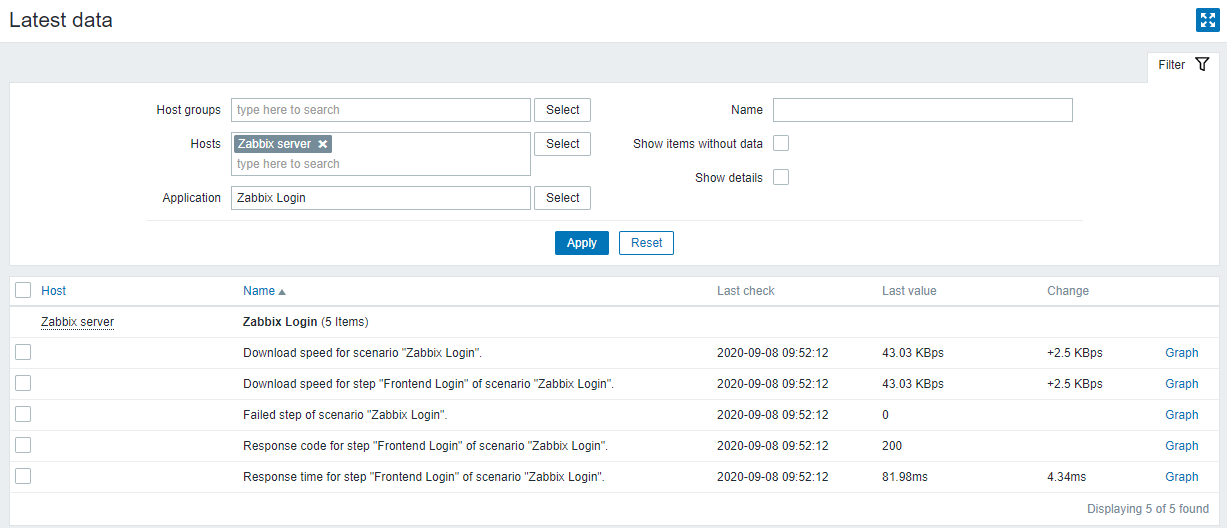
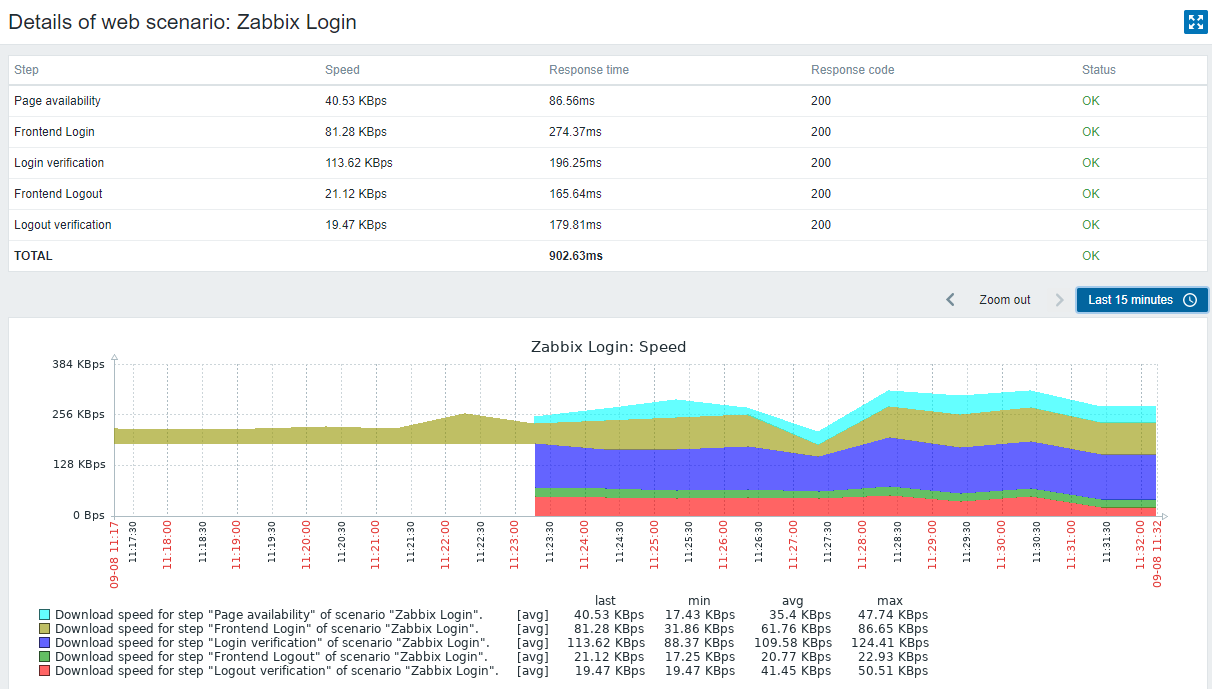
To view web scenario information go to Monitoring → Hosts, locate the host in the list and click on the Web hyperlink in the last column:
Triggers and Notifications
Create alarm triggers
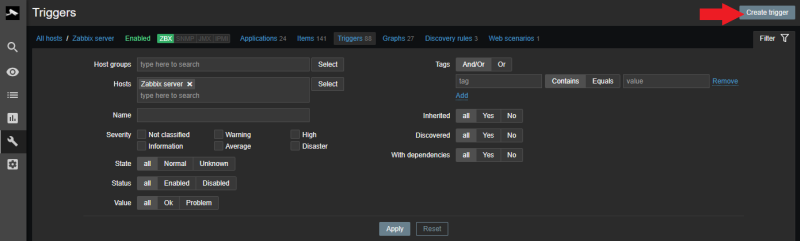
A trigger is the event that triggers email notifications. Triggers are built using an expression. Select Configuration > Hosts > Host Name > Triggers and click Create trigger:
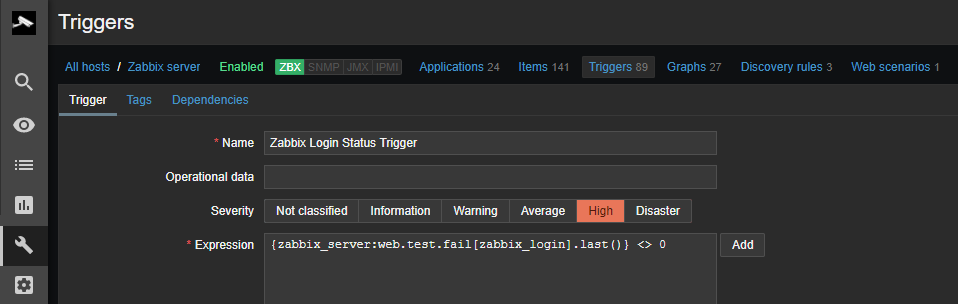
In this example, since you are using a web scenario, you want to create a trigger for when the web scenario code is anything other than a success based on the HTTP status code. Use the following expression:
{Host_as_set_in_zabbix:web.test.fail[web_scenario_name].last()} <> 0

Realworld Scenarios
Discourse Forum
You can test for the Health Check URL URL/srv/status. This URL will return a ok when your Discourse installation is happy:
Elasticsearch Cluster
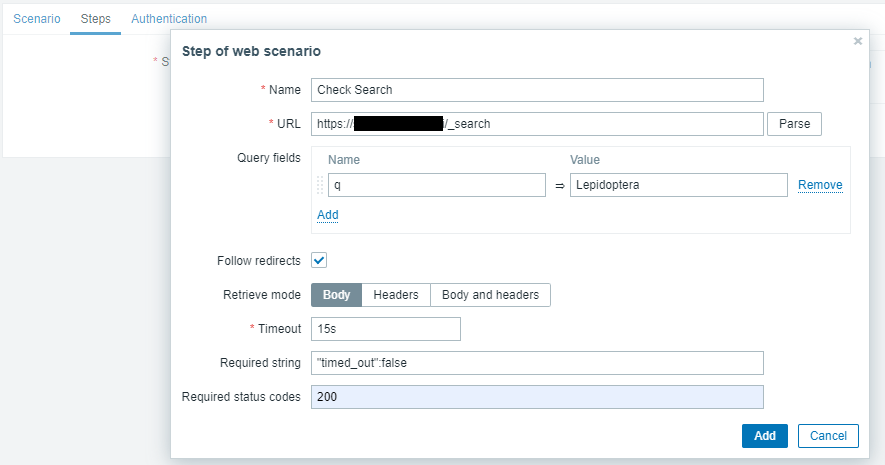
You can test for the Health Check URL URL/_cluster/health. Or use a search query that will return a guaranteed answer - for example you can check if the request did not time-out "timed_out":false:
https://elasticsearch.instar.com/_search?q=Lepidoptera

{"took":289,"timed_out":false,"_shards":{"total":10,"successful":10,"skipped":0,"failed":0},"hits":{"total":{"value":0,"relation":"eq"},"max_score":null,"hits":[]}}
Gitlab C/I Server
GitLab provides liveness and readiness probes to indicate service health and reachability to required services. These probes report on the status of the database connection, Redis connection, and access to the filesystem. To control access to those endpoints via IP whitelisting, you can add single hosts or use IP ranges:
nano /etc/gitlab/gitlab.rb
And add / uncomment the following:
### Monitoring settings
###! IP whitelist controlling access to monitoring endpoints
gitlab_rails['monitoring_whitelist'] = ['127.0.0.0/8', 'my-zabbix-server-ip']
###! Time between sampling of unicorn socket metrics, in seconds
gitlab_rails['monitoring_unicorn_sampler_interval'] = 10
Save the file and reconfigure GitLab for the changes to take effect. Reconfigure Omnibus GitLab with:
sudo gitlab-ctl reconfigure
Using the Gitlab Endpoints
| Health | Checks whether the application server is running. It does not verify the database or other services are running. This endpoint circumvents Rails Controllers and is implemented as additional middleware BasicHealthCheck very early into the request processing lifecycle. |
| Readiness | The readiness probe checks whether the GitLab instance is ready to accept traffic via Rails Controllers. The check by default does validate only instance-checks. If the all=1 parameter is specified, the check will also validate the dependent services (Database, Redis, Gitaly etc.) and gives a status for each. |
| Liveness | Checks whether the application server is running. This probe is used to know if Rails Controllers are not deadlocked due to a multi-threading. |
You can now curl the following URLs from your Zabbix Server terminal to verify that they are accessible:
curl https://git.example.com/-/health

GitLab OK
curl https://git.example.com/-/readiness

"status":"ok"
curl https://git.example.com/-/readiness?all=1

{"status":"ok","master_check":[{"status":"ok"}],"db_check":[{"status":"ok"}],"redis_check":[{"status":"ok"}],"cache_check":[{"status":"ok"}],"queues_check":[{"status":"ok"}],"shared_state_check":[{"status":"ok"}],"gitaly_check":[{"status":"ok","labels":{"shard":"default"}}]}
curl https://git.example.com/-/liveness

{"status":"ok"}
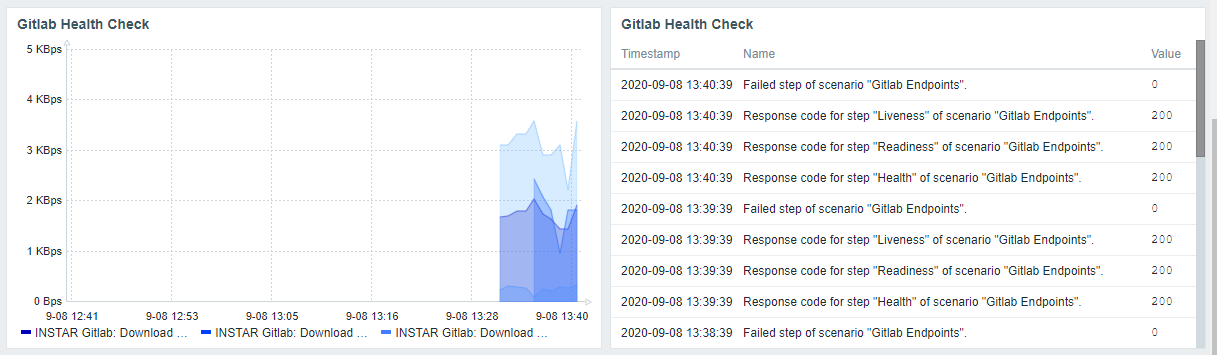
Now all you have to do is adding checks for those URLs in the Zabbix dashboard.
PostFix Queues
Download the template_postfix.xml file, import the template into Zabbix and apply it to your Zimbra server.
To connect your client server run the following commands:
# Install the following packages

# Debian/Ubuntu
apt install pflogsumm bc zabbix-agent zabbix-sender

# RHEL/Centos (replace the zabbix version with the one your using)
yum install https://repo.zabbix.com/zabbix/4.2/rhel/6/x86_64/zabbix-release-4.2-1.el6.noarch.rpm
yum install postfix-perl-scripts bc zabbix-agent zabbix-sender

cp zabbix_postfix.sh /usr/local/sbin/
cp pygtail.py /usr/local/sbin/
chmod +x /usr/local/sbin/pygtail.py
chmod +x /usr/local/sbin/zabbix_postfix.sh

cp zabbix_postfix /etc/sudoers.d/
chmod 440 /etc/sudoers.d/zabbix_postfix

# Zabbix agent config dir may change, see https://github.com/rafael747/zabbix-postfix/issues/3#issuecomment-623629611
# Debian/Ubuntu
cp zabbix_postfix.conf /etc/zabbix/zabbix_agentd.conf.d/

# RHEL/Centos
cp zabbix_postfix.conf /etc/zabbix/zabbix_agentd.d/

service sudo restart
service zabbix-agent restart
And add a crontab entry:
# Zabbix check
*/5 * * * * /usr/local/sbin/zabbix_postfix.sh 1>/dev/null 2>/dev/null'
Check if FTP Service is Up
FTP Template
Start by adding the official FTP template - this allows you to add a graph to your dashboard showing the availability of your FTP service:
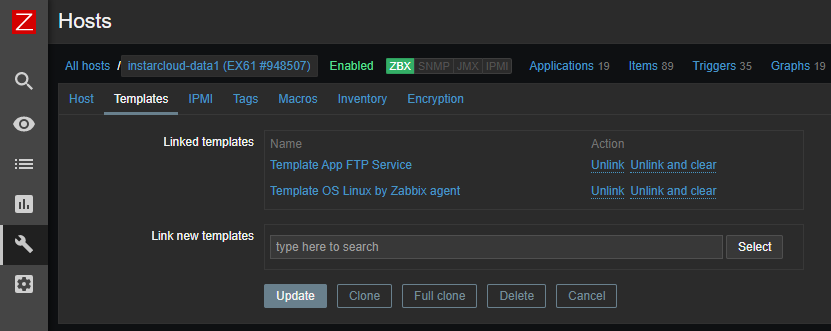
Creates a TCP connection and expects the first 4 characters of the response to be “220 ”, then sends “QUIT\r\n”. Default port 21 is used if not specified.
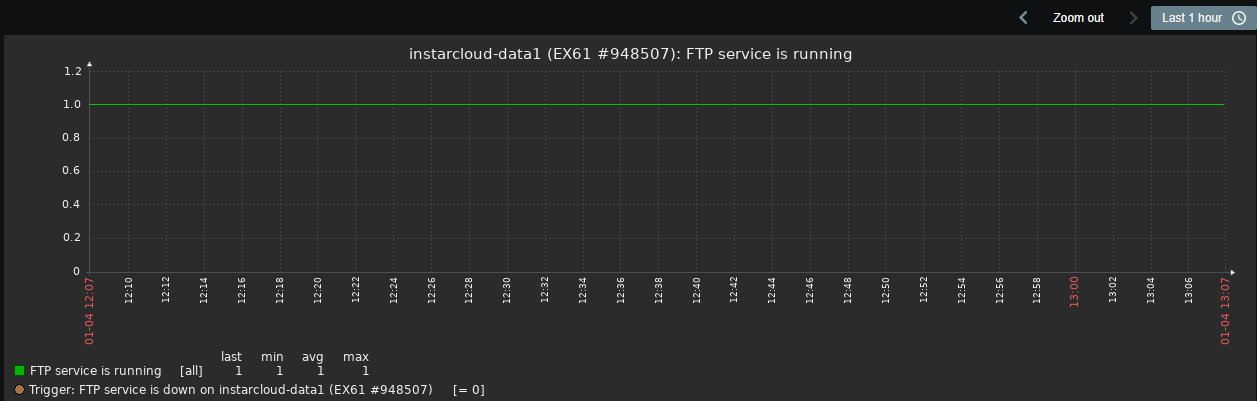
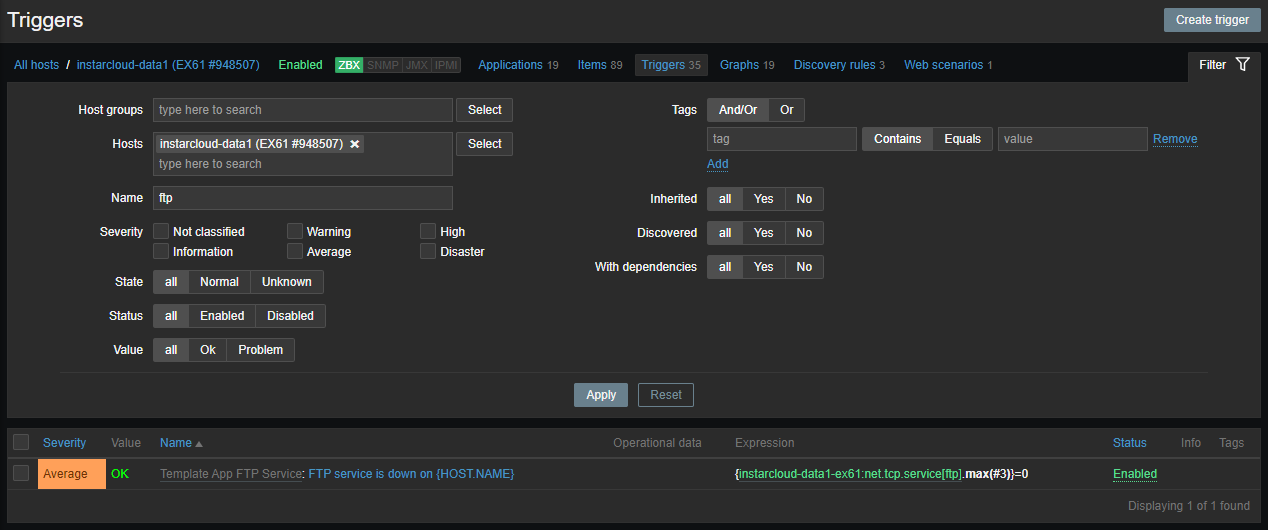
The template comes with a trigger that we can use to send out notifications:
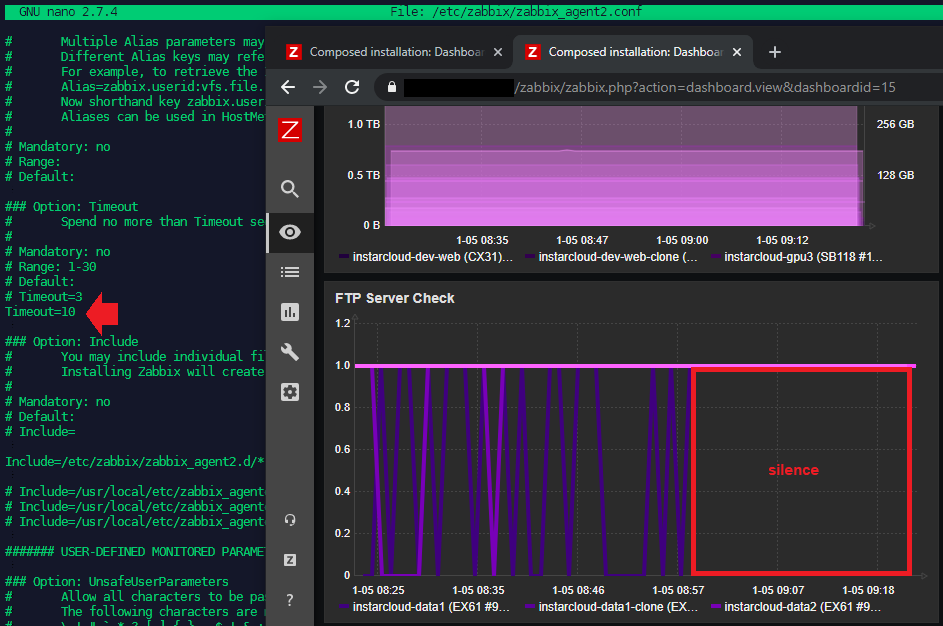
Adjusting the Timeout
The default timeout for the ftp_check started giving me constant alerts. The only way to adjust the this value that I could find was a global timeout in the agent configuration file:
nano /etc/zabbix/zabbix_agent2.conf
### Option: Timeout
#       Spend no more than Timeout seconds on processing
#
# Mandatory: no
# Range: 1-30
# Default:
# Timeout=3
Timeout=10
After setting it to 10s the barrage of Slack notifications finally ceased: