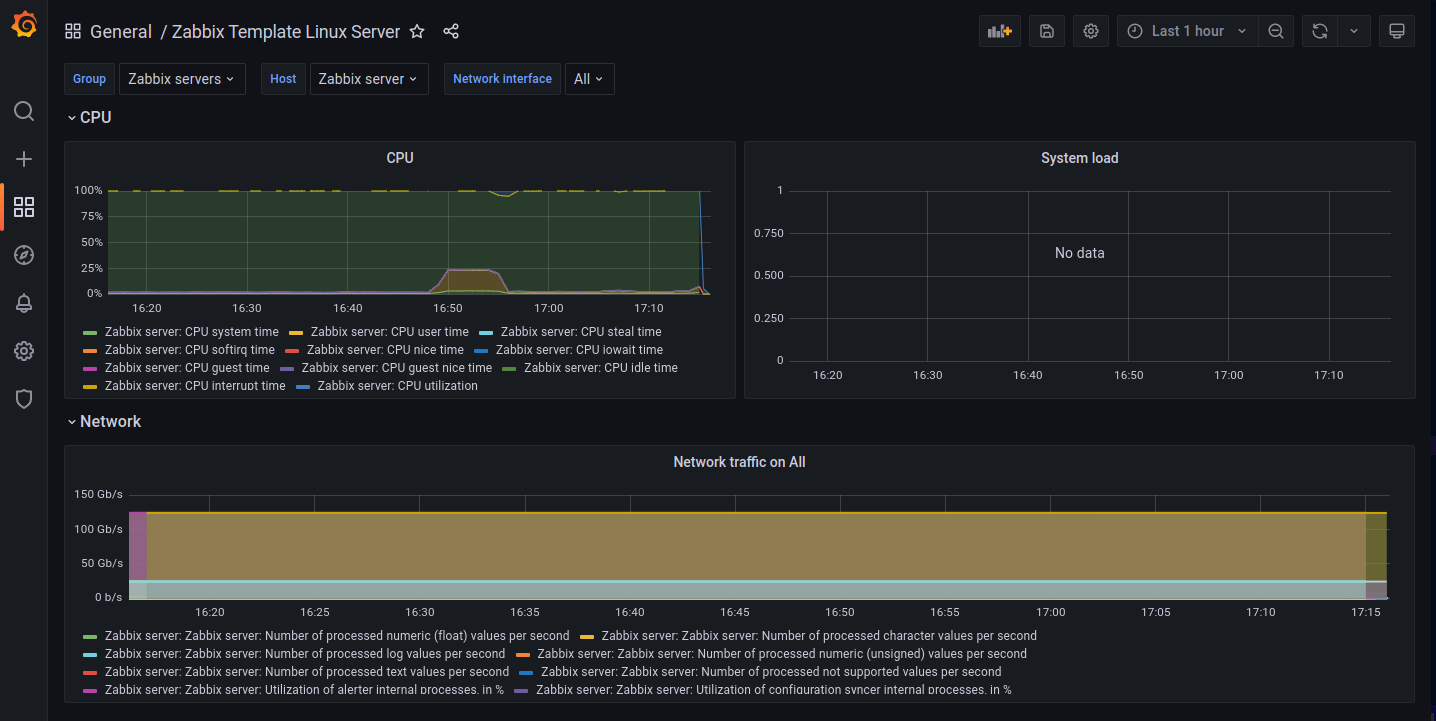
Grafana Dashboard for Zabbix v6

Set Up Grafana
Docker
To install Grafana directly run:
docker run -d --name=grafana -p 3000:3000 grafana/grafana-oss:latest
We now have to add the Zabbix plugin using the Grafana CLI:
docker exec -ti grafana sh -c 'grafana-cli plugins install alexanderzobnin-zabbix-app'
docker exec -ti grafana sh -c 'grafana-cli plugins ls'
docker restart grafana
I just realized that the restart part is not going to work. You will have to mount a volume into the container where the plugins are stored to persist them
-v /my/dir:/var/lib/grafana.
mkdir -p /opt/grafana-compose/grafana
docker run -d --name=grafana -p 3000:3000 -v /opt/grafana-compose/grafana:/var/lib/grafana grafana/grafana-oss:latest
I did not run this - you probably have to check folder permissions for the volume mount - docker-compose below. But let's go straight to Docker-Compose and add the Grafana instructions to our compose file.
Docker-Compose
Note: I am embedding this into my compose file for the Zabbix Server (see full file below )
grafana-server:
  container_name: grafana
  image: grafana/grafana-oss:latest
  networks:
    zbx_net_backend:
      ipv4_address: 172.16.239.105
      aliases:
        - grafana-server
    zbx_net_frontend:
      ipv4_address: 172.16.238.105
  links:
    - zabbix-server
    - postgres-server
  restart: always
  ports:
    - '3000:3000'
  volumes:
    - './grafana:/var/lib/grafana'
    - './grafana/log:/var/log/grafana'
  environment:
    GF_INSTALL_PLUGINS: alexanderzobnin-zabbix-app
  depends_on:
    - zabbix-server
    - postgres-server
mkdir -p /opt/grafana-compose/grafana/{lib,log}
Run the file with docker-compose up. If you keep seeing the following error message and the folder /opt/grafana-compose/grafana (please change the directory to your needs) remains empty, you have an permission issue:
Permission Issues
mkdir: can't create directory '/var/lib/grafana/plugins': Permission denied
GF_PATHS_DATA='/var/lib/grafana' is not writable.
You may have issues with file permissions, more information here: http://docs.grafana.org/installation/docker/#migrate-to-v51-or-later
mkdir: can't create directory '/var/lib/grafana/plugins': Permission denied
Change the directory owner to 1000 and change the write permissions to something sensible (I picked 777 for my test run... not to be used in production):
chown 1000:1000 /opt/grafana-compose/grafana/*
chmod 777 /opt/grafana-compose/grafana/*
UPDATE
UPDATE: For Grafana >v5.1 the user permission changed!
Migrate to v7.3 or later
The Grafana Docker image runs with the root group (id 0) instead of the grafana group (id 472), for better compatibility with OpenShift. If you extend the official Docker image you may need to change your scripts to use the root group instead of grafana.
Find User ID
docker run -ti \
--name grafana \
--rm \
-p 3000:3000 \
--volume "/opt/grafana-compose/grafana/lib:/var/lib/grafana" \
grafana/grafana-oss:latest /bin/ash
docker exec -ti grafana /bin/ash
/usr/share/grafana $ ls -la /var/lib/grafana
drwxrwxrwx    1 grafana  root          4096 Jan 26 04:41 .
drwxr-xr-x    1 root     root          4096 Jan 17 19:47 ..
drwxr-x---    3 grafana  root          4096 Jan 26 04:41 alerting
drwx------    2 grafana  root          4096 Jan 26 04:41 csv
-rw-r-----    1 grafana  root        765952 Jan 26 04:41 grafana.db
drwxrwxrwx    2 grafana  root          4096 Jan 17 19:47 plugins
drwx------    2 grafana  root          4096 Jan 26 04:41 png
/usr/share/grafana $ id grafana
uid=472(grafana) gid=0(root) groups=0(root),0(root)
The folder permission that the container uses are grafana:root and the user grafana has the user ID 472. Let's exit the container and change the folder permission for the volume mount accordingly:
chown 472:root /opt/grafana-compose/grafana/*
chmod 777 /opt/grafana-compose/grafana/*
Manually Add the Zabbix Plugin
Now we can add the volume mounts and see if the container runs without issues:
docker run \
--name grafana \
-p 3000:3000 \
--rm \
--user 472 \
--volume "/opt/grafana-compose/grafana/lib:/var/lib/grafana" \
--volume "/opt/grafana-compose/grafana/log:/var/log/grafana" \
grafana/grafana-oss:latest
I can now manually add the Zabbix plugin using the Grafana CLI:
docker exec -ti grafana sh -c 'grafana-cli plugins install alexanderzobnin-zabbix-app'
✔ Downloaded alexanderzobnin-zabbix-app v4.2.4 zip successfully

docker exec -ti grafana sh -c 'grafana-cli plugins ls'
installed plugins:
alexanderzobnin-zabbix-app @ 4.2.4
Ok - this worked. Now stop the container and restart it using the backend and ingress network:
Test Networking
docker network ls
NETWORK ID     NAME                                     DRIVER    SCOPE
a77ffbc59dd5   bridge                                   bridge    local
ffa0e09265d3   host                                     host      local
23e217540a23   ingress_gateway                          bridge    local
019b12ab4063   none                                     null      local
cb89d1ef4ff9   zabbix-server-compose_zbx_net_backend    bridge    local
f0affabc4e0a   zabbix-server-compose_zbx_net_frontend   bridge    local
docker run \
--name grafana \
-p 3000:3000 \
--user 472 \
--volume "/opt/grafana-compose/grafana/lib:/var/lib/grafana" \
--volume "/opt/grafana-compose/grafana/log:/var/log/grafana" \
--network "zabbix-server-compose_zbx_net_backend" \
grafana/grafana-oss:latest
docker network connect ingress_gateway grafana
Check if all containers are connected:
ingress_gateway
docker network inspect ingress_gateway
[
    {
        ...
        "Containers": {
            "361cb37eb411420638b57495a839339c2b27aa0be341363135e7a29fcce95ee0": {
                "Name": "grafana",
                "EndpointID": "a6e13ee59ade2a7df0dc22e1738aab89a91ae767dba7dc5c42a36f8519e5c390",
                "MacAddress": "02:42:ac:13:00:03",
                "IPv4Address": "172.19.0.3/16",
                "IPv6Address": ""
            },
            "7e117e131aa0563eb58b3bbaa0b2efab89c8238b5b3e2fbb40b8b241ccd2000f": {
                "Name": "zabbix-web",
                "EndpointID": "de6bf76a17ce27db6d6ed6cb84ddf242f011629a1325b88b309e3f1e0be7b3d5",
                "MacAddress": "02:42:ac:13:00:02",
                "IPv4Address": "172.19.0.2/16",
                "IPv6Address": ""
            }
        },
        ...
    }
]
zbx_net_backend
docker network inspect zabbix-server-compose_zbx_net_backend
[
    {
        ...
        "ConfigOnly": false,
        "Containers": {
            "361cb37eb411420638b57495a839339c2b27aa0be341363135e7a29fcce95ee0": {
                "Name": "grafana",
                "EndpointID": "82bacee2889fcfa663c710a33e1889a4a5b583c8bf048a3b8a5e0a8c2b50902d",
                "MacAddress": "02:42:ac:10:ef:02",
                "IPv4Address": "172.16.239.2/24",
                "IPv6Address": ""
            },
            "7e117e131aa0563eb58b3bbaa0b2efab89c8238b5b3e2fbb40b8b241ccd2000f": {
                "Name": "zabbix-web",
                "EndpointID": "30611f24b5aafba9ea4f0133015387d70fcfe4f0dc7fe287aafe15e2c6d5214c",
                "MacAddress": "02:42:ac:10:ef:66",
                "IPv4Address": "172.16.239.102/24",
                "IPv6Address": ""
            },
            "879fbf896901367fe0d6e6fa8d7788b991c035427904ac396ee6fbaf03590e2d": {
                "Name": "zabbix-agent",
                "EndpointID": "4ae3d85c3a3e5525c46dbb6d51b9c6a52b64a466af2be4dc94d139b551212468",
                "MacAddress": "02:42:ac:10:ef:67",
                "IPv4Address": "172.16.239.103/24",
                "IPv6Address": ""
            },
            "96fddea6d6a140b49caf6d01ff973d42194ad0f07568a065d3bdc1cf2b2b960c": {
                "Name": "zabbix-db",
                "EndpointID": "c4563664729387fbfedf01ae6481c08501d6ab355bac66fb277377ba090dab27",
                "MacAddress": "02:42:ac:10:ef:68",
                "IPv4Address": "172.16.239.104/24",
                "IPv6Address": ""
            },
            "cfd6c7326a0ce5fb882a41c7838a501e27d8a201b6cdc01dccfa1449941c85f4": {
                "Name": "zabbix-server",
                "EndpointID": "e276e172f44fd8aa3549e68f99f9d4fb480bd6748c3831115622cda296ab63c2",
                "MacAddress": "02:42:ac:10:ef:65",
                "IPv4Address": "172.16.239.101/24",
                "IPv6Address": ""
            }
        },
        ...
    }
]
Back on track with Docker-Compose
Delete the installed content in /opt/grafana-compose/grafana/lib, wrap everything into a single neat compose file and re-run it in docker-compose:
services:
  grafana-server:
    container_name: grafana-server
    image: grafana/grafana-oss:latest
    networks:
      zbx_net_backend:
        ipv4_address: 172.16.239.105
        aliases:
          - grafana-server
      zbx_net_frontend:
        ipv4_address: 172.16.238.105
      ingress_gateway:
        aliases:
          - grafana-server
    restart: always
    ports:
      - '3000:3000'
    user: '472'
    volumes:
      - './grafana/lib:/var/lib/grafana'
      - './grafana/log:/var/log/grafana'
    environment:
      GF_INSTALL_PLUGINS: alexanderzobnin-zabbix-app

networks:
  zbx_net_frontend:
    external: true
    name: zabbix-server-compose_zbx_net_frontend
  zbx_net_backend:
    external: true
    name: zabbix-server-compose_zbx_net_backend
  ingress_gateway:
    external: true
    name: ingress_gateway
Configure Grafana
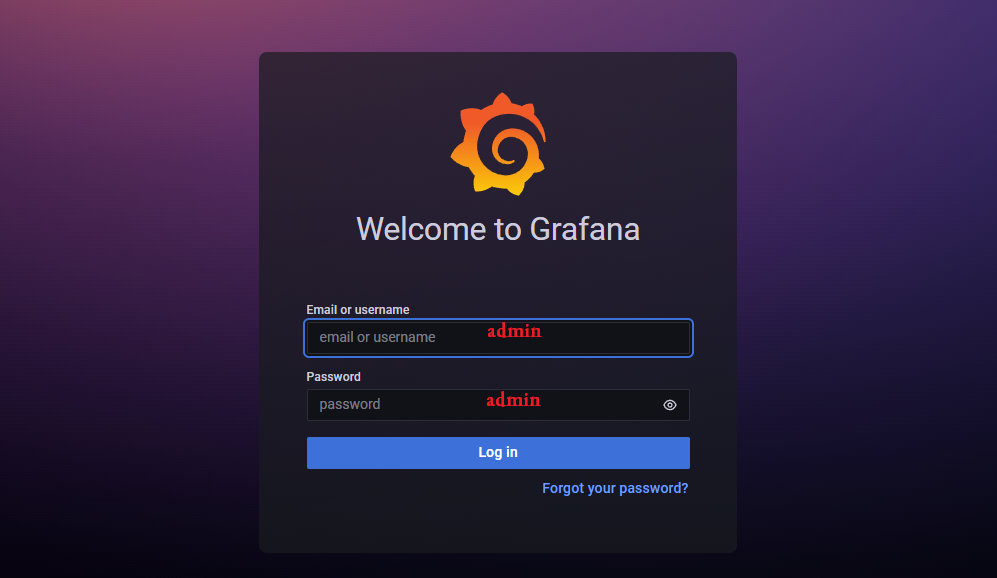
Now visit your server IP on Port 3000 and change the default admin/admin login:
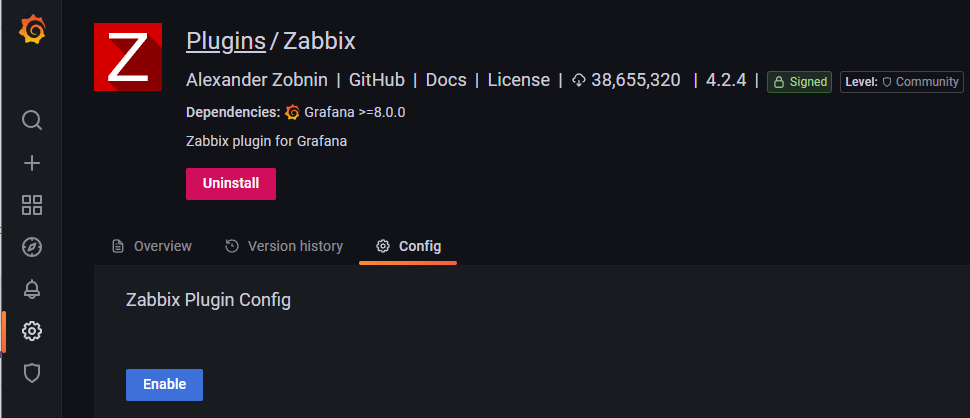
Check out the plugin page and you should be able to find and enable the Zabbix plugin:
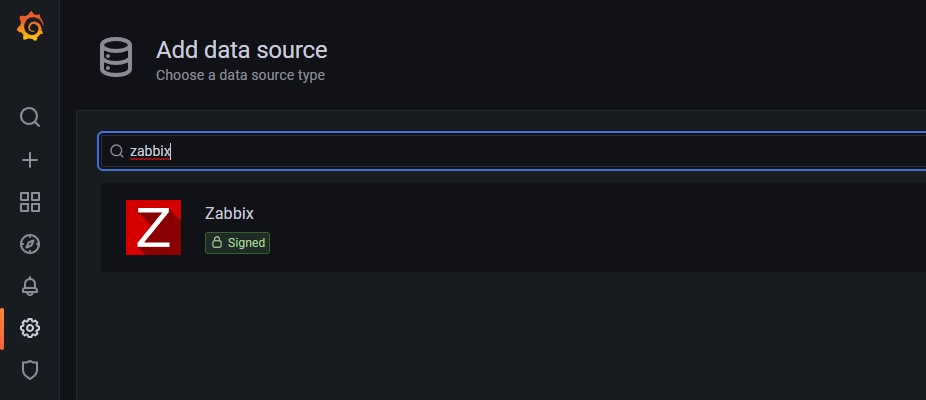
With the result that you now have the option to use Zabbix as a Data Source:
Continue by adding a user to Zabbix that can be used by Grafana:
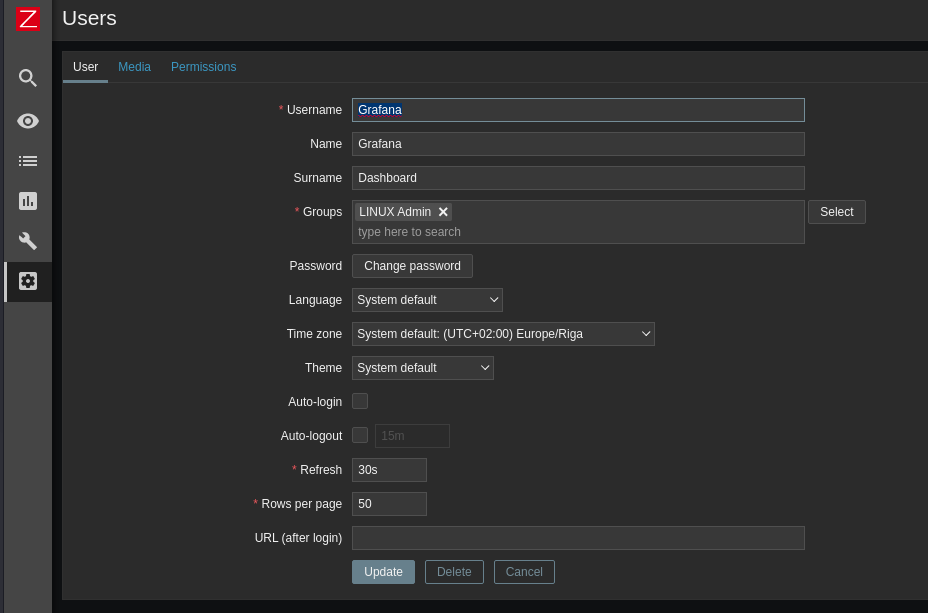
When you add the Zabbix Data Source you will be asked to add the server address https://my.domain.com/zabbix/api_jsonrpc.php as well as the login you just created - leave everything else default! For my test server I simply use the docker domain name of my zabbix-web container + port 8080 - http://zabbix-web:8080/api_jsonrpc.php:

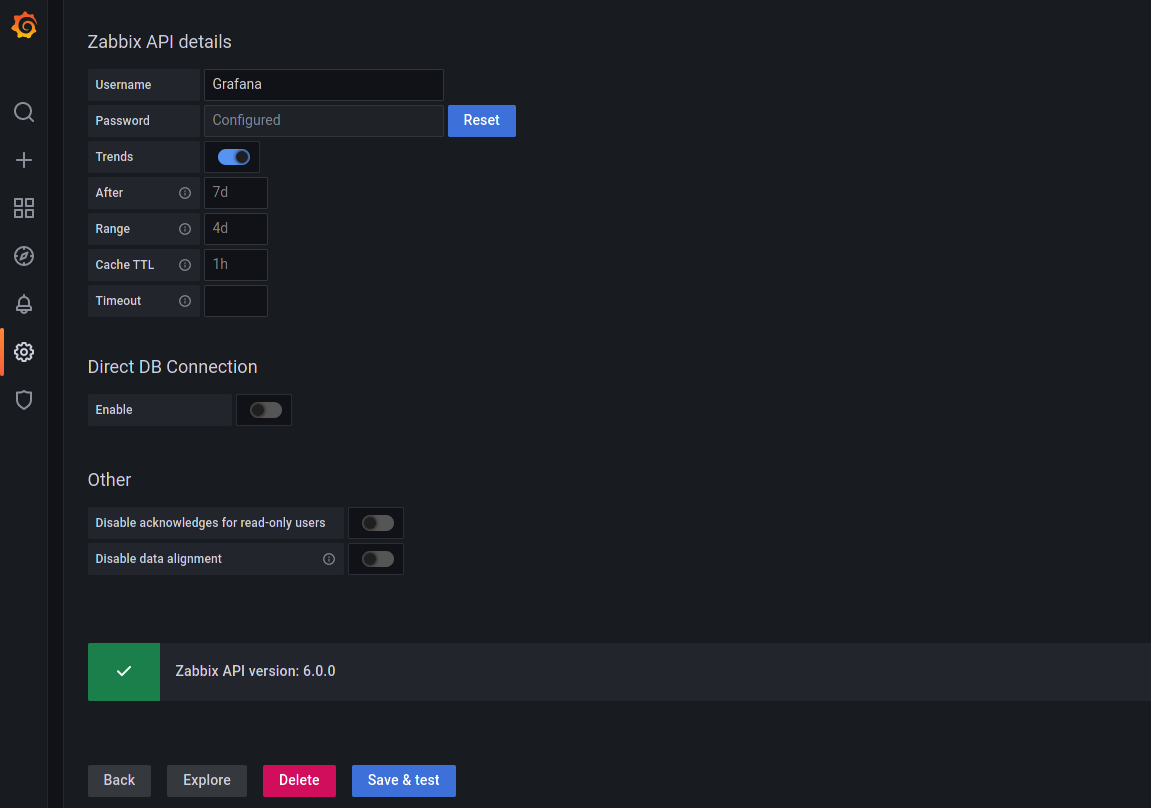
Scroll down and add the Grafana user you added to Zabbix and click Save & Test to verify that everything worked - Grafana should show your server API version once successfully connected:
Switch from the Settings tab to Dashboards and import the dashboards templates that are included in the Zabbix plugin:

Problem - No Data
When I access the template dashboards I am greeted with No data ...

Checking in Zabbix I can see that the Grafana user (used by the Zabbix Plugin to connect to the Zabbix frontend) is online. So the configuration should be OK:

Trying to connect to the Zabbix API from a machine outside of the virtual docker network using the LAN IP of my server - http://192.168.2.111:8080/api_jsonrpc.php:
{
    "jsonrpc": "2.0",
    "method": "apiinfo.version",
    "params": [],
    "id": 1
}
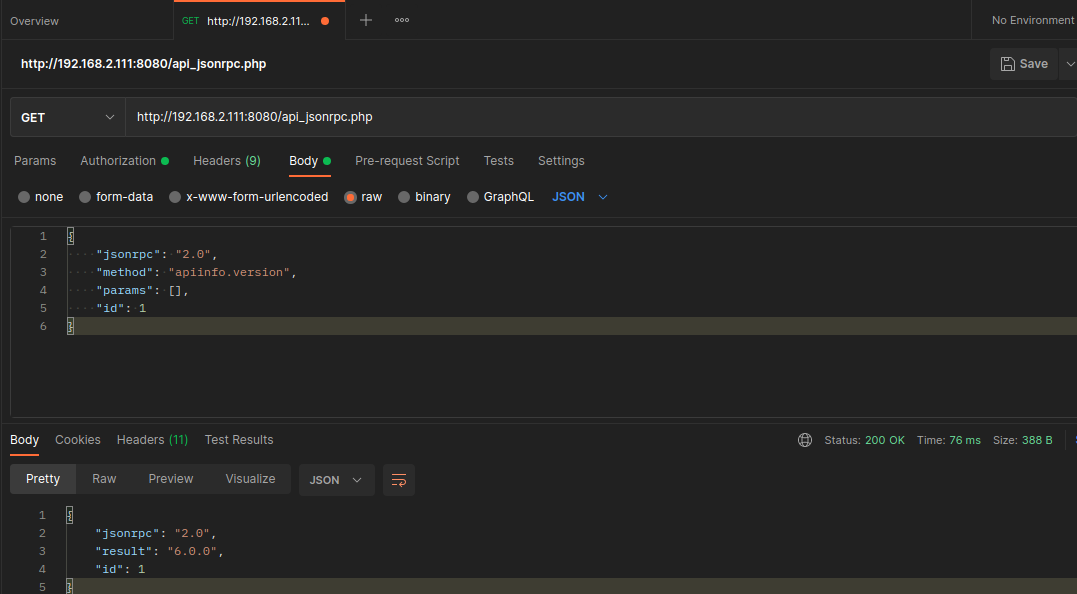
I get the same response that - presumably - the Zabbix Plugin also got when I added the data source:
{
    "jsonrpc": "2.0",
    "result": "6.0.0",
    "id": 1
}
So the API can be accessed - I also tested the user authentication. Of course here I am using my servers LAN IP instead of the Docker internal container IP...
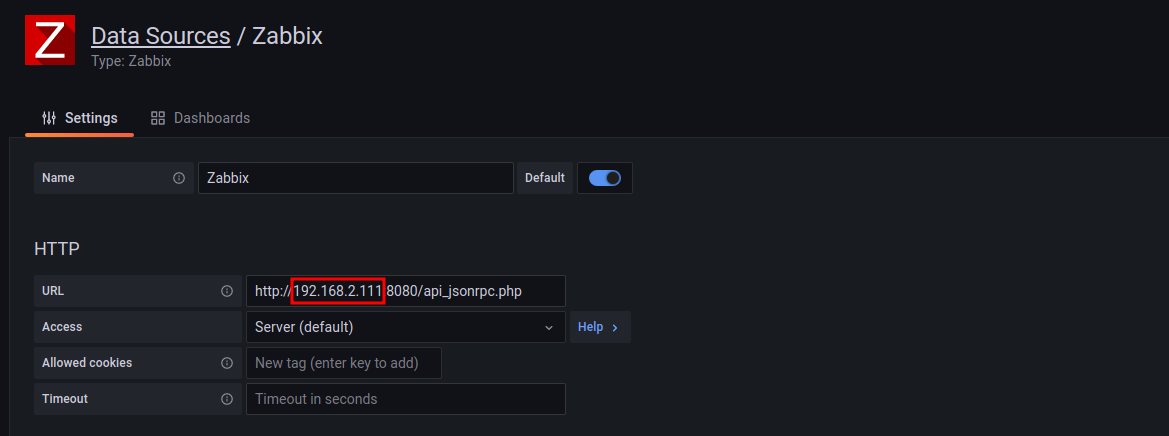
And lo and behold... now it is working!
