Zabbix v6 Apache 2 Monitor

Apache Module mod_status
Activate the Server Status module:
sudo a2enmod status
And add the configuration to:
cp /etc/apache2/mods-available/status.conf /etc/apache2/mods-available/status.conf.bak
nano /etc/apache2/mods-available/status.conf
Enabling Status Support for the host you want to monitor:
<IfModule mod_status.c>
        # Allow server status reports generated by mod_status,
        # with the URL of http://servername/server-status
        # Uncomment and change the "192.0.2.0/24" to allow access from other hosts.

        <Location /server-status>
                SetHandler server-status

                ##Allow all IPs to access for testing
                #Allow from all

                ##Allow only localhost and local server IP
                Order deny,allow
                Deny from all
                Allow from 127.0.0.1 ::1
                #Allow from Your.Server.IP.Address.Here

                ##Limit access from other hosts
                #Require local
                #Require ip 192.0.2.0/24
                #Require host example.com
        </Location>

        # Keep track of extended status information for each request
        ExtendedStatus On

        # Determine if mod_status displays the first 63 characters of a request or
        # the last 63, assuming the request itself is greater than 63 chars.
        # Default: Off
        #SeeRequestTail On
        <IfModule mod_proxy.c>
                # Show Proxy LoadBalancer status in mod_status
                ProxyStatus On
        </IfModule>
</IfModule>
Check config integrity and restart:
apachectl configtest
apache2 -t # or httpd -t
systemctl restart apache2 # or httpd
Or all in one line:
apache2ctl -t && apache2ctl graceful
Test the status output by:
curl http://127.0.0.1/server-status?auto
127.0.0.1
ServerVersion: Apache/2.4.25 (Debian) OpenSSL/1.0.2q
ServerMPM: prefork
Server Built: 2018-11-03T18:46:19
CurrentTime: Tuesday, 09-Nov-2021 07:24:39 CET
RestartTime: Tuesday, 09-Nov-2021 06:44:31 CET
ParentServerConfigGeneration: 1
ParentServerMPMGeneration: 0
ServerUptimeSeconds: 2408
ServerUptime: 40 minutes 8 seconds
Load1: 0.07
Load5: 0.24
Load15: 0.53
Total Accesses: 319
Total kBytes: 1554
CPUUser: 5.52
CPUSystem: 2.06
CPUChildrenUser: 0
CPUChildrenSystem: 0
CPULoad: .314784
Uptime: 2408
ReqPerSec: .132475
BytesPerSec: 660.837
BytesPerReq: 4988.39
BusyWorkers: 2
IdleWorkers: 8
Scoreboard: _W____W___............................................................................................................................................
TLSSessionCacheStatus
CacheType: SHMCB
CacheSharedMemory: 512000
CacheCurrentEntries: 35
CacheSubcaches: 32
CacheIndexesPerSubcaches: 88
CacheTimeLeftOldestAvg: 123
CacheTimeLeftOldestMin: 0
CacheTimeLeftOldestMax: 262
CacheIndexUsage: 1%
CacheUsage: 1%
CacheStoreCount: 279
CacheReplaceCount: 0
CacheExpireCount: 244
CacheDiscardCount: 0
CacheRetrieveHitCount: 0
CacheRetrieveMissCount: 38
CacheRemoveHitCount: 0
CacheRemoveMissCount: 0
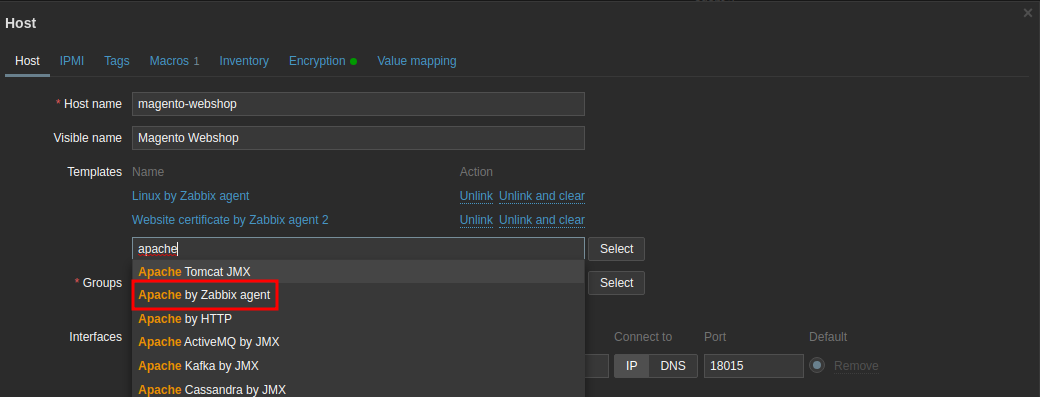
Configure Zabbix Agent
Stat by adding the Apache by Zabbix Agent template:
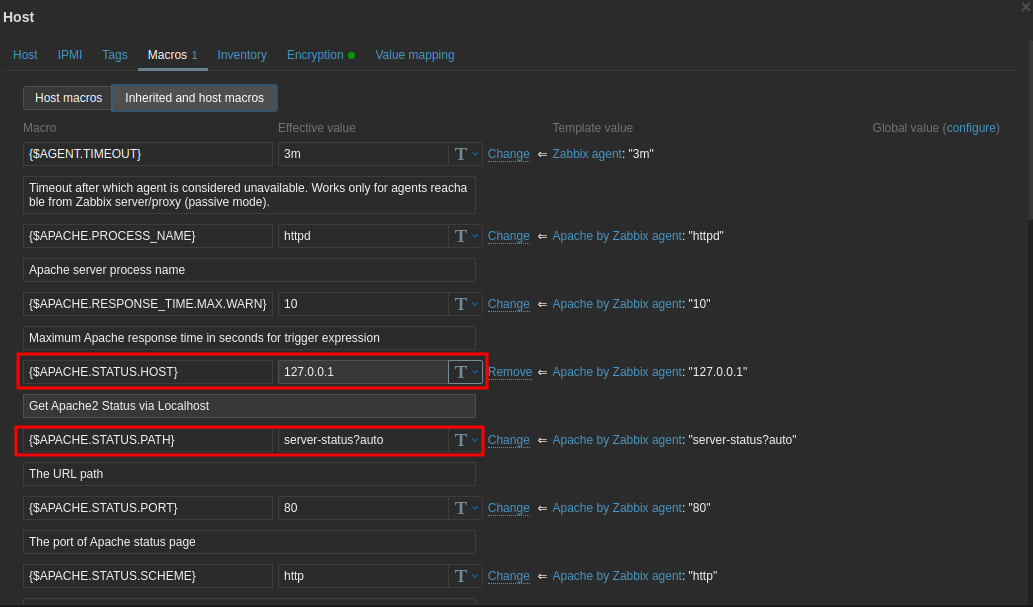
Make sure that the server is set to 127.0.0.1 and save the configuration:
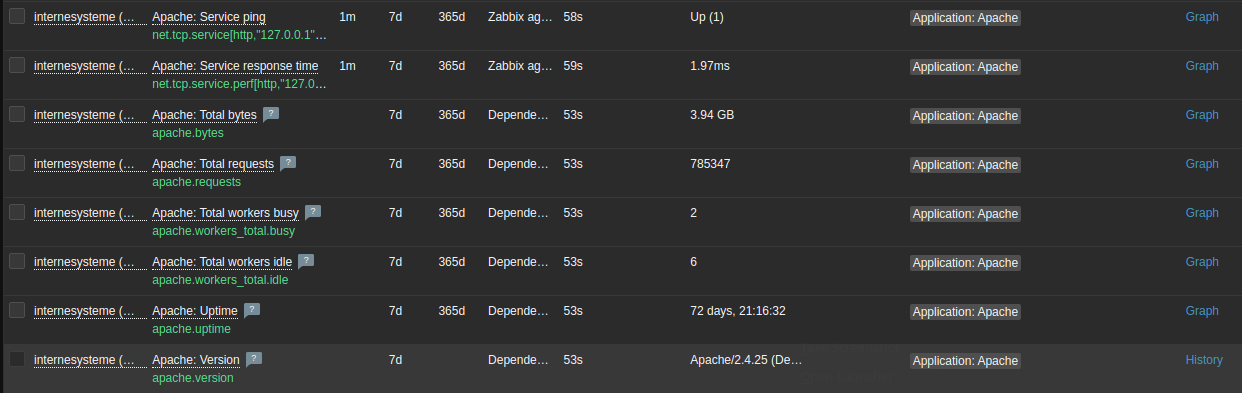
Check latest data to see if your agent is working:
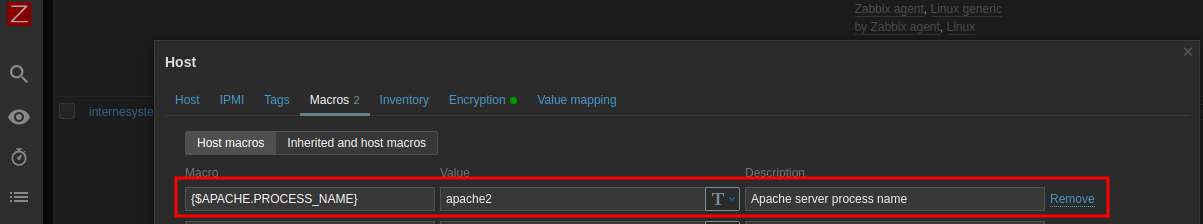
ERROR :: Apache Process is not running

The process name is set to httpd by default - which is correct for Apache on CentOS. But has to be changed to apache2 for Debian: