Testing the Zabbix API with Postman

I am using the Zabbix Version 6.0rc set up using Docker Compose on a server with the IP address 192.168.2.111. The Zabbix frontend is running on port 8080. I am testing because I ran into issues trying to connect a Grafana instance.
Postman
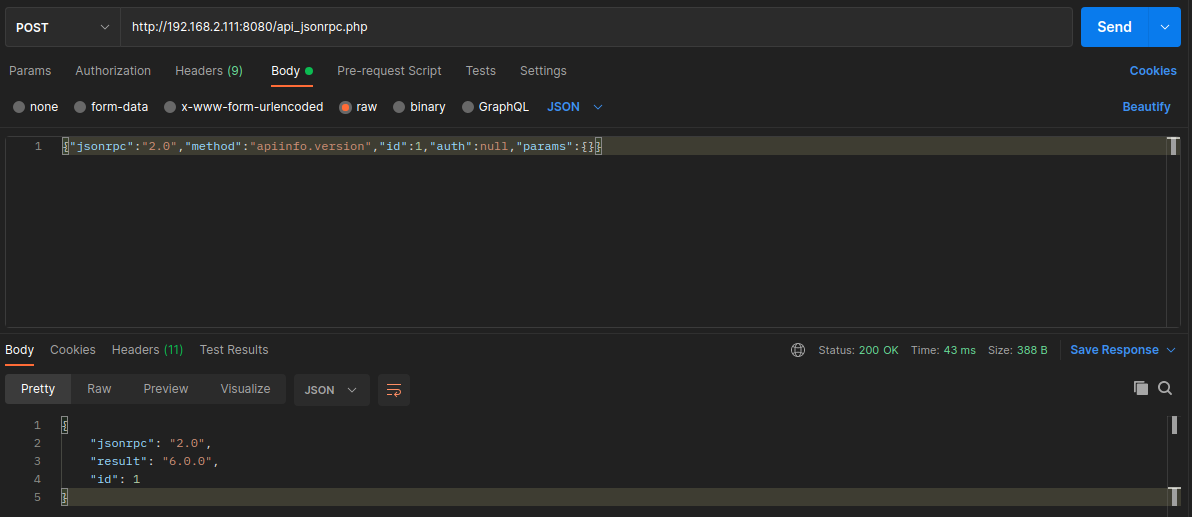
The Zabbix API is available on http://192.168.2.111:8080/api_jsonrpc.php via POST requests using the Content-Type application/json-rpc:

Adding the following JSON Body returns the API version:
{"jsonrpc":"2.0","method":"apiinfo.version","id":1,"auth":null,"params":{}}

Which is in my case Version 6.0.0:
{
    "jsonrpc": "2.0",
    "result": "6.0.0",
    "id": 1
}
Authentication
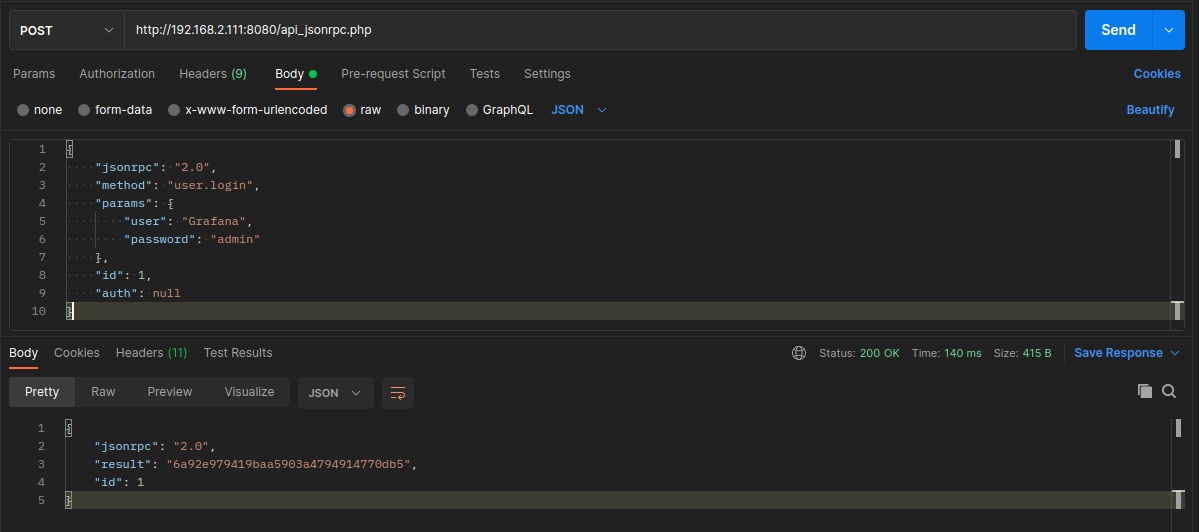
All other request require a user login. I am going to use a user I created for Grafana that has the necessary API Access Rights:

{
    "jsonrpc": "2.0",
    "method": "user.login",
    "params": {
        "user": "Grafana",
        "password": "admin"
    },
    "id": 1,
    "auth": null
}
- jsonrpc : the version of the JSON-RPC protocol used by the API; the Zabbix API implements JSON-RPC version 2.0;
- method : the API method being called;
- params : parameters that will be passed to the API method;
- id : an arbitrary identifier of the request;
- auth : a user authentication token; since we don't have one yet, it's set to null.
This returns our User Authentication Token 6a92e979419baa5903a4794914770db5 that we can use for future requests:
{
    "jsonrpc": "2.0",
    "result": "6a92e979419baa5903a4794914770db5",
    "id": 1
}
Retrieving Data
Equipped with the auth token I can now start querying my Zabbix hosts:
host.get
{
    "jsonrpc": "2.0",
    "method": "host.get",
    "params": {
        "output": [
            "hostid",
            "host"
        ],
        "selectInterfaces": [
            "interfaceid",
            "ip"
        ]
    },
    "id": 2,
    "auth": "6a92e979419baa5903a4794914770db5"
}
My test system only has the main Zabbix server added and this is reflected in the response:
{
    "jsonrpc": "2.0",
    "result": [
        {
            "hostid": "10084",
            "host": "Zabbix server",
            "interfaces": [
                {
                    "interfaceid": "1",
                    "ip": "172.16.239.103"
                }
            ]
        }
    ],
    "id": 2
}
trend.get
The Trend endpoint requires you to specify an itemid. You can find the item ID by opening any graph from your host and take a look at the URL - e.g. the CPU idle time:
http://192.168.2.111:8080/history.php?action=showgraph&itemids%5B%5D=42264
Here the item ID is 42264:
{
    "jsonrpc": "2.0",
    "method": "trend.get",
    "params": {
        "output": [
            "itemid",
            "clock",
            "num",
            "value_min",
            "value_avg",
            "value_max"
        ],
        "itemids": [
            "42264"
        ],
        "limit": "1"
    },
    "id": 2,
    "auth": "6a92e979419baa5903a4794914770db5"
}
And this returns the following response:
{
    "jsonrpc": "2.0",
    "result": [
        {
            "itemid": "42264",
            "clock": "1643439600",
            "num": "55",
            "value_min": "86.672412",
            "value_avg": "97.39452778181823",
            "value_max": "98.332146"
        }
    ],
    "id": 2
}