Zabbix v7 Redis Template

Zabbix 7.4 Redis Template
I am using a Redis Database in a ML/AI prediction queue and want to monitor it using the official Redis Template in Zabbix v7.4. So let's first select it in the host configuration
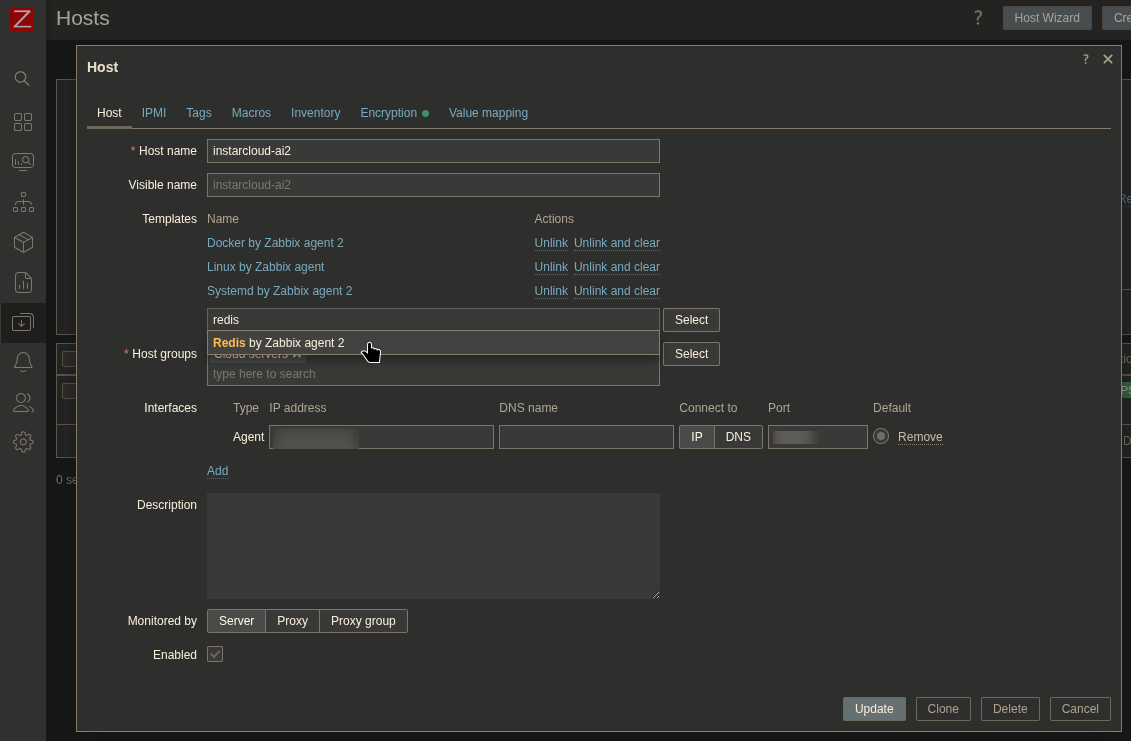
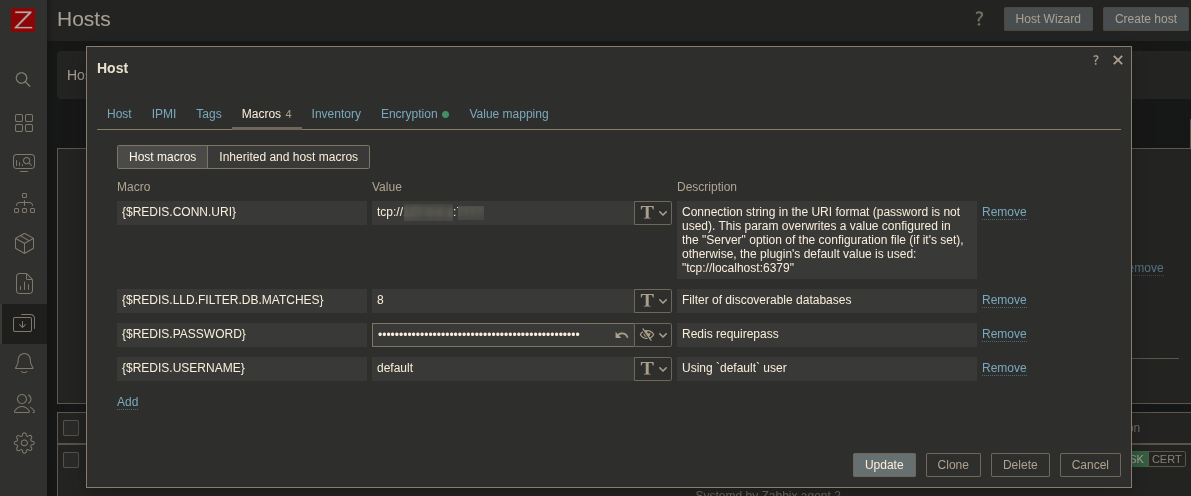
Now add the following macros as needed:
{$REDIS.CONN.URI}: tcp://<ServerIP:RedisPort>{$REDIS.LLD.FILTER.DB.MATCHES}: <DB you want to monitor>{$REDIS.PASSWORD}: <The password you configured in your Redis config as requiredpass>{$REDIS.USERNAME}: default
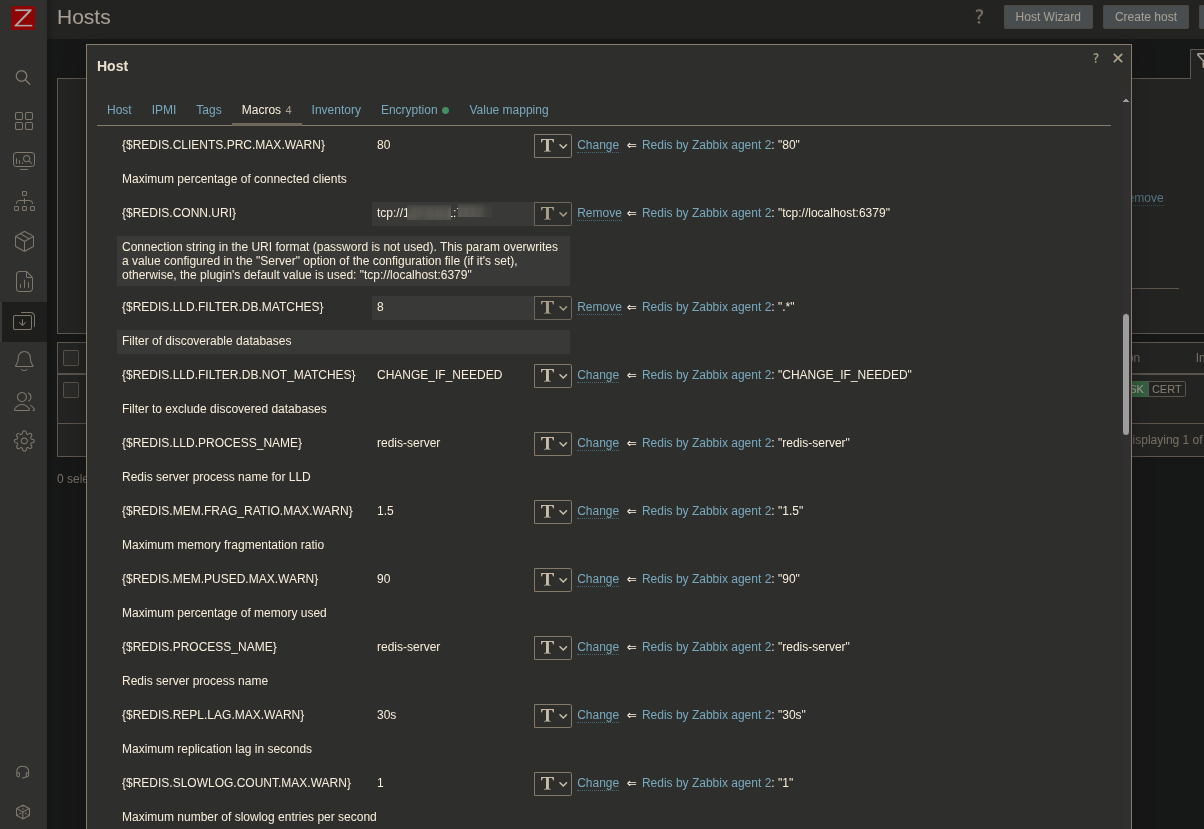
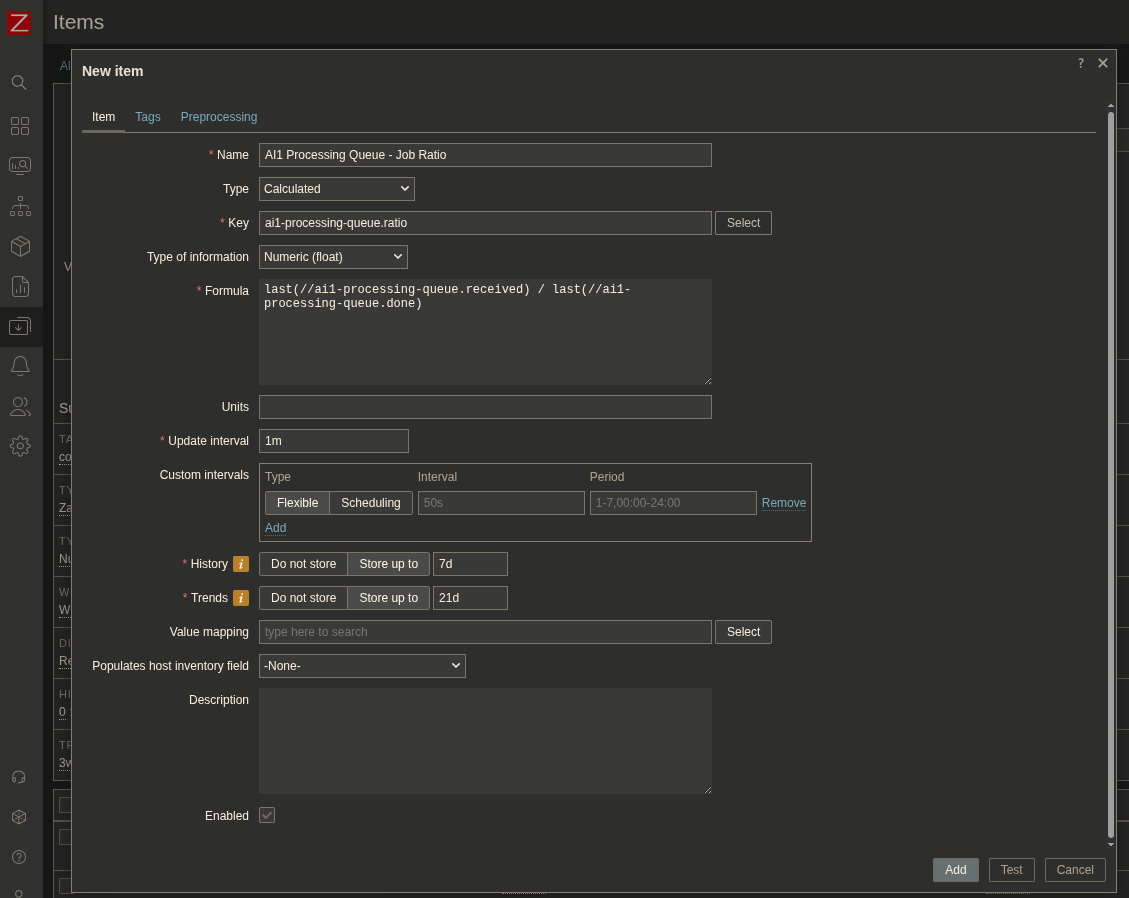
A Bug?
I could not get a connection - the ping timed out even though triggering it manually on the server (not through the zabbix-agent2) works just fine. Since the item configuration did not show that it was using the Redis Macros I added thoses to the Zabbix Agent configuration file on my host system:
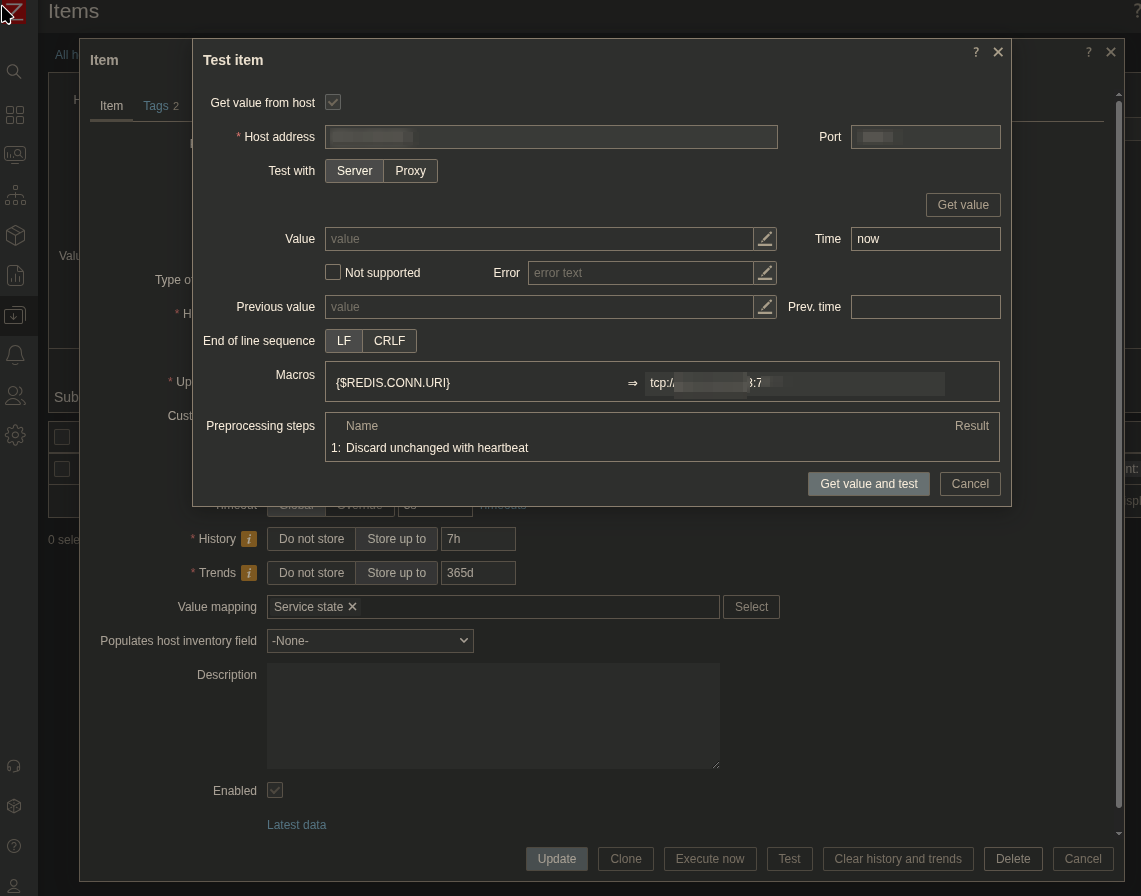
By adding this information here on the client host the agent suddenly connected and I started seeing data come in:
nano /etc/zabbix/zabbix_agent2.d/plugins.d/redis.conf
### Option: Plugins.Redis.Default.Uri
#       Uri to connect. Default value used if no other is specified.
#
# Mandatory: no
# Range:
#   Must matches the URI format.
#   Supported schemas: "tcp" and "unix".
#   Embedded credentials will be ignored.
# Default:
Plugins.Redis.Default.Uri=<ServerIP:RedisPort>

### Option: Plugins.Redis.Default.Password
#       Password to send to protected Redis server. Default value used if no other is specified.
#
# Mandatory: no
# Default:
Plugins.Redis.Default.Password=<The password you configured in your Redis config as requiredpass>
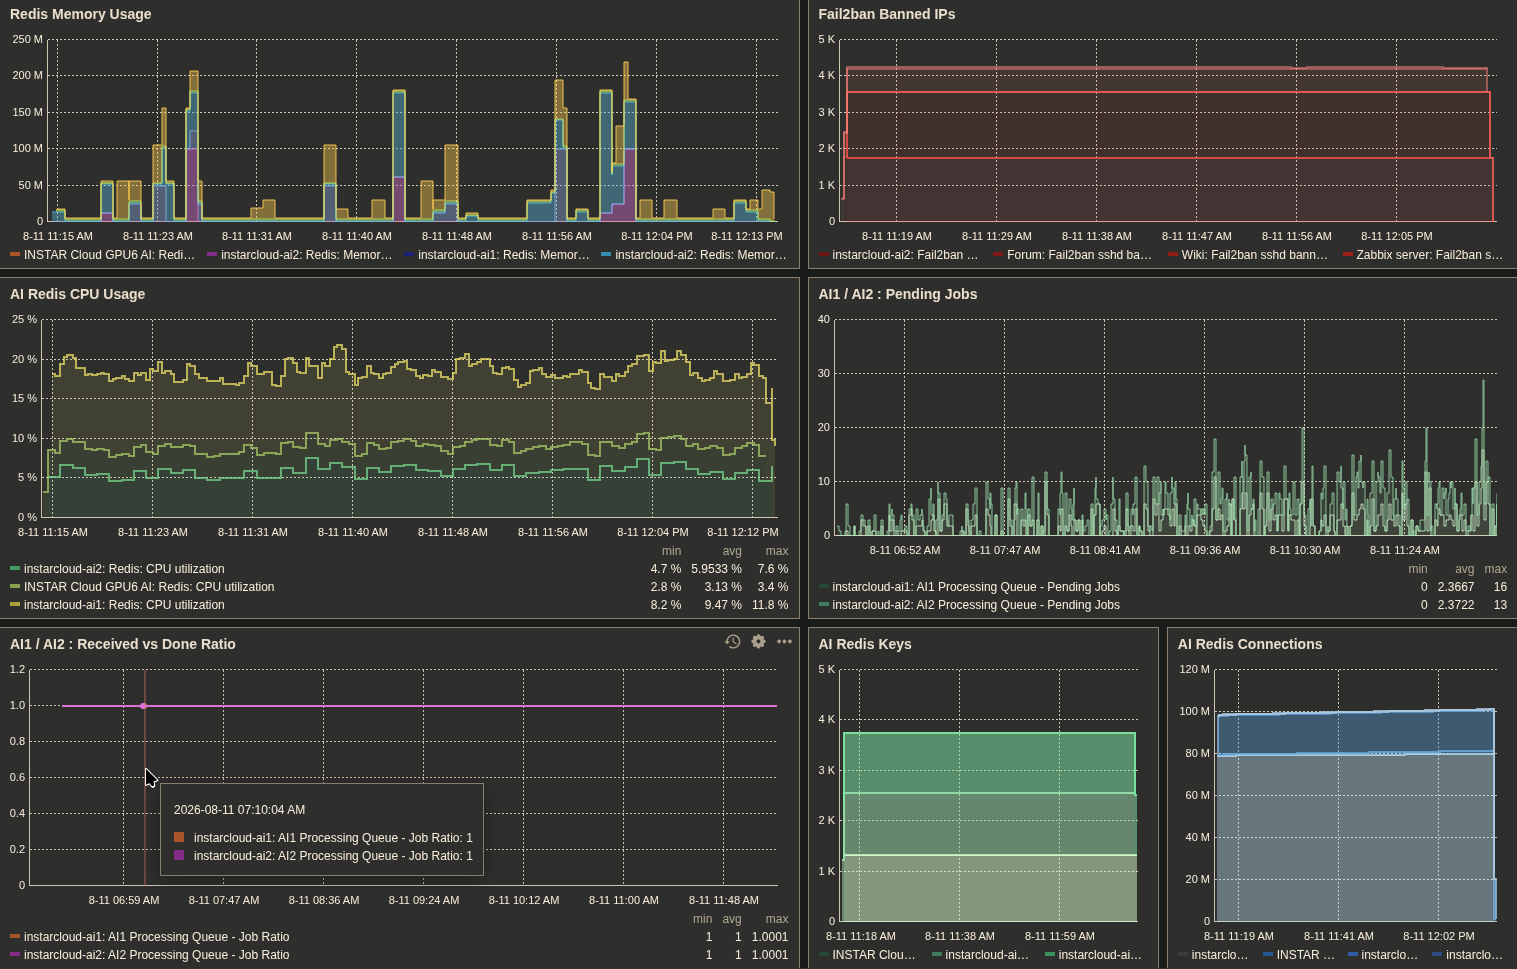
Redis Memory fragmentation ratio is too high
The trigger for this warning is defined as:
Redis: Memory fragmentation ratio is too high (over
{$REDIS.MEM.FRAG_RATIO.MAX.WARN}in 15m)min(/instarcloud-ai1/redis.memory.fragmentation_ratio,15m)>{$REDIS.MEM.FRAG_RATIO.MAX.WARN}
This ratio is an indication of memory mapping efficiency:
- Value over 1.0 indicate that memory fragmentation is very likely. Consider restarting the Redis server so the operating system can recover fragmented memory, especially with a ratio over 1.5.
- Value under 1.0 indicate that Redis likely has insufficient memory available. Consider optimizing memory usage or adding more RAM.
> `redis-cli -h <Redis Server IP> -p <Redis Server Port> -a <Redis Server requirepass> ping`
PONG


> `redis-cli -h <Redis Server IP> -p <Redis Server Port> -a <Redis Server requirepass> INFO memory | grep -E 'used_memory_human|used_memory_rss_human|mem_fragmentation_ratio|mem_fragmentation_bytes'`

used_memory_human:2.02M # The actual data size Redis is holding.
used_memory_rss_human:24.57M # The total memory the OS thinks Redis is using.
mem_fragmentation_ratio:12.27
mem_fragmentation_bytes:23667072 # The exact amount of RAM currently wasted.
If mem_fragmentation_bytes is low (e.g., less than a few hundred megabytes), you can safely ignore this warning or tune the Zabbix threshold macro {$REDIS.MEM.FRAG_RATIO.MAX.WARN} higher.
Reclaim Memory Safely
You can tell the memory allocator to immediately release completely empty pages back to the operating system:
redis-cli -h <Redis Server IP> -p <Redis Server Port> -a <Redis Server requirepass> MEMORY PURGE
If the ratio climbs right back up, you should enable Redis's Active Defragmentation:
redis-cli -h <Redis Server IP> -p <Redis Server Port> -a <Redis Server requirepass> CONFIG SET activedefrag yes
If this solves the issue add activedefrag yes to your Redis config:
activedefrag yes

# Only defrag if fragmentation waste is above 100MB
active-defrag-ignore-bytes 100mb

# Only start defrag if ratio is above 1.10 (10%)
active-defrag-threshold-lower 10

# Maximum CPU percentage dedicated to defragging when fragmentation is critical
active-defrag-cycle-max 25