Sensors Data and Grafana

Grafana allows you to query, visualize, alert on and understand your metrics no matter where they are stored. Create, explore, and share dashboards with your team and foster a data driven culture. The Grafana project can also be found on Github.
Installing Grafana
Since I am working on a Raspberry Pi 2 (the same would be true for a v3) with Raspbian installed I will grab the download link for Grafana for Ubuntu & Debian(ARMv7):
Correction I seemed to be using a single core version of the Raspberry Pi 2 that requires the ARMv6 build - see below
wget https://dl.grafana.com/oss/release/grafana_6.1.6_armhf.deb
sudo apt-get install -y adduser libfontconfig1
sudo dpkg -i grafana_6.1.6_armhf.deb
In my case libfontconfig1 was missing dependencies after the installation and and the installation of Grafana failed - I was able to fix this issue by running sudo apt --fix-broken install and restart the Grafana installation.
We can use SystemD to start the Grafana Service:
sudo systemctl daemon-reload
sudo systemctl start grafana-server
sudo systemctl status grafana-server
Unfortunately I am seeing error messages here - and as stated above, I was using the wrong build of Grafana...
09:11:51 raspberrypi systemd[1]: Stopped Grafana instance.
09:11:51 raspberrypi systemd[1]: grafana-server.service: Start request repeated too quickly.
09:11:51 raspberrypi systemd[1]: Failed to start Grafana instance.
09:11:51 raspberrypi systemd[1]: grafana-server.service: Unit entered failed state.
09:11:51 raspberrypi systemd[1]: grafana-server.service: Failed with result ‘signal’.
So once again, with more feeling (and the correct version Ubuntu & Debian(ARMv6)):
sudo systemctl stop grafana-server
sudo apt-get remove --auto-remove grafana

wget https://dl.grafana.com/oss/release/grafana-rpi_6.1.6_armhf.deb
sudo apt-get install -y adduser libfontconfig1
sudo dpkg -i grafana-rpi_6.1.6_armhf.deb

sudo /bin/systemctl daemon-reload
sudo /bin/systemctl enable grafana-server
sudo /bin/systemctl start grafana-server
This time everything worked as planned:
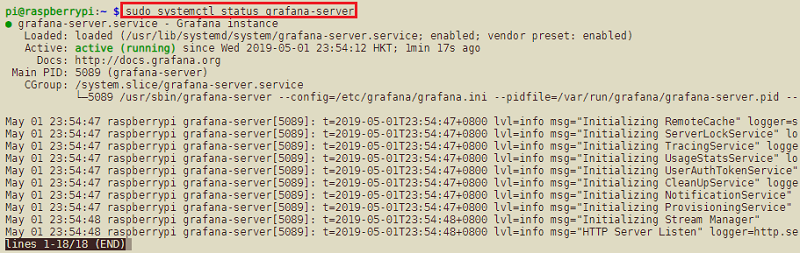
I had to wait for a few minutes for the service to come online - on a RasPi v3 this should be less of an issue... I am now able to access the Grafana frontend on the IP address of my Pi and the port 3000 - http://192.168.2.64:3000/login. The default login is user = admin and password = admin - but you will be asked to change this right away:
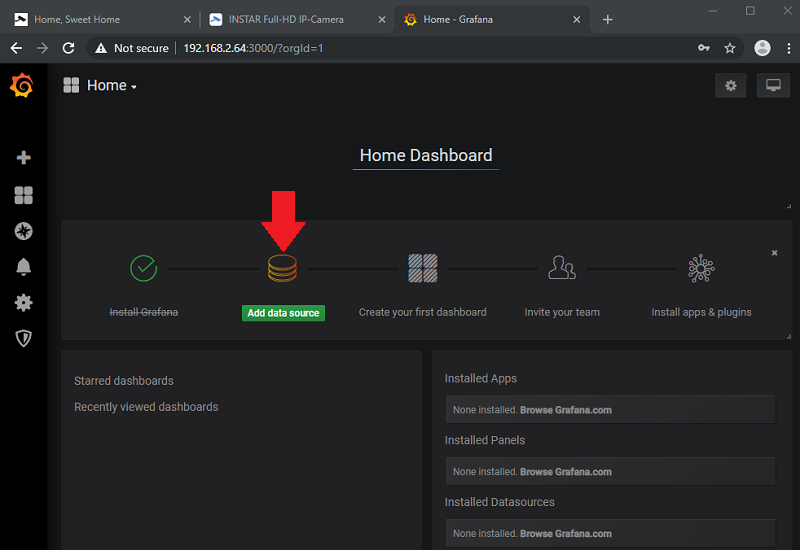
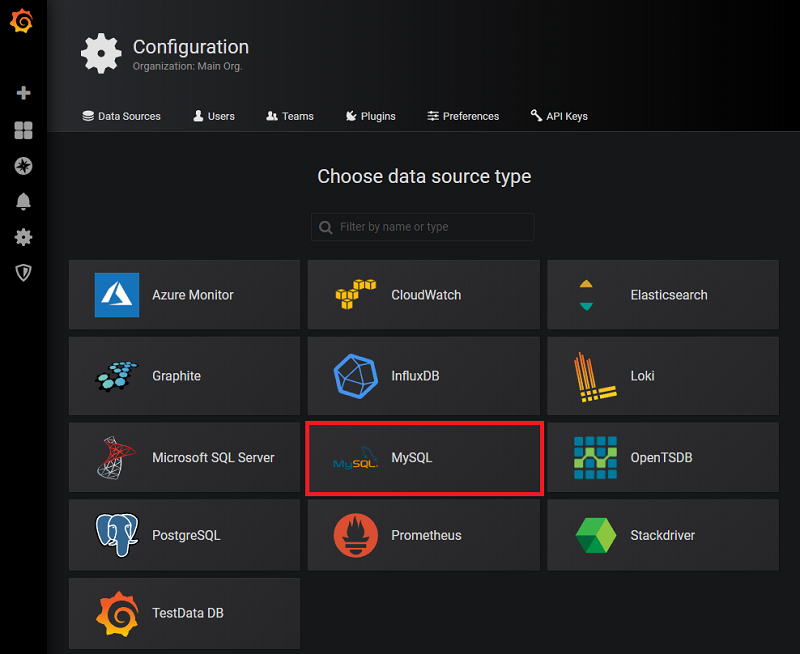
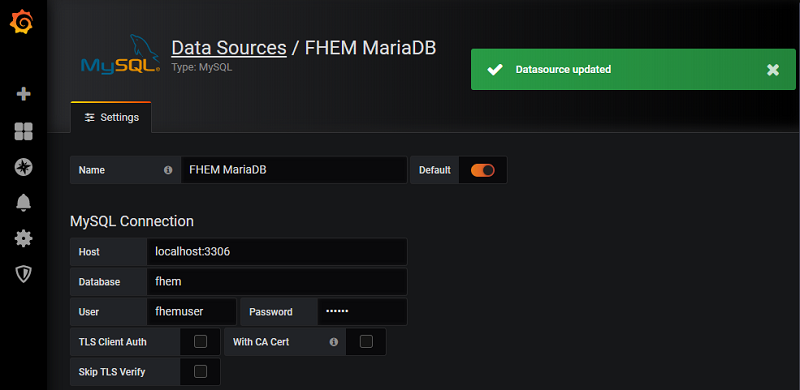
We are greeted by a wizard that leads us through the initial set up process - we have to start by adding a data source. I am going to use the data I started storing inside a MariaDB database in another article and choose MySQL:
For this project I created a database called fhem. MariaDB is running on the same Pi and can be accessed over localhost:3306 by the user fhemuser with the password instar. Clicking on Save & Test at the bottom of the page tells me that the Database Connection is OK:
Back to the Home Screen I now click on New Dashboard:
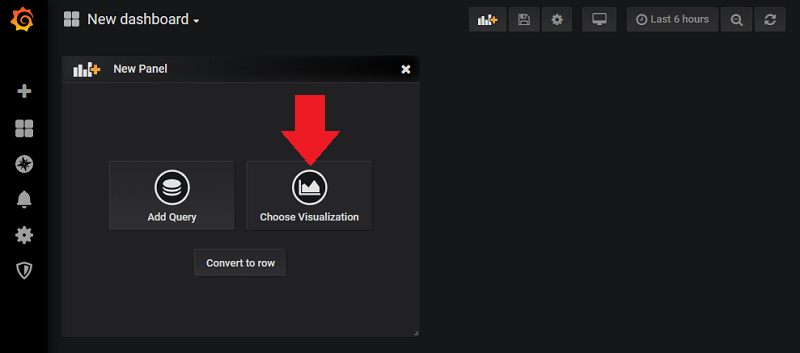
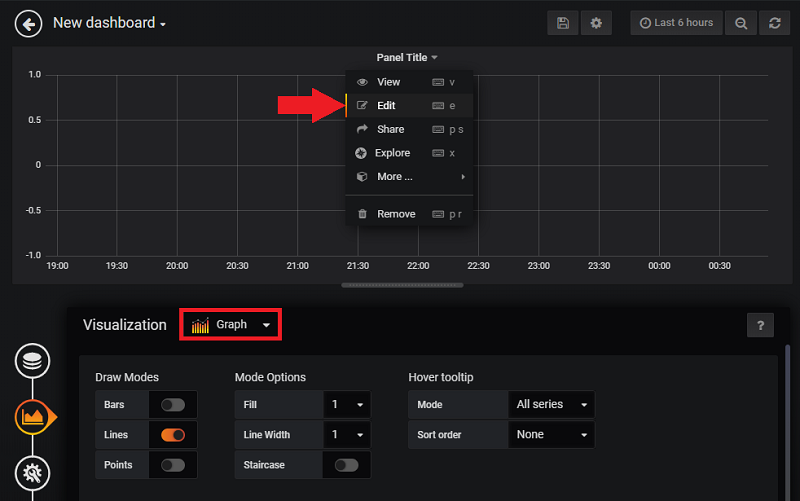
Here I can choose a Visualization and select a Graph. On the empty coordinate system I can click on the Panel Title to add a data source for the graph:
My database has two tables - one with the current values and one table that collects the historic values for all readings. And both have 7 rows - TIMESTAMP, DEVICE, TYPE, EVENT, READING, VALUE, UNIT:
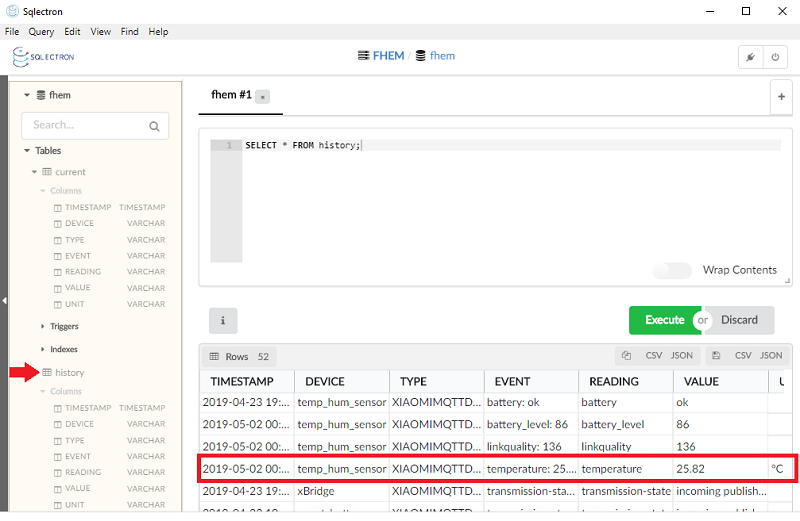
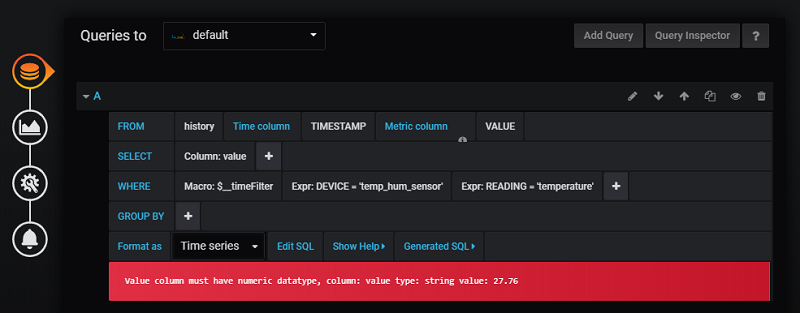
For my graph I am interested in the history table and I want to begin to create a plot of the Temperature Sensor Reading from the temp_hum_sensor device. Grafana helps with creating the corresponding SQL query. But I am receiving an error because the numeric reading is stored as type string:
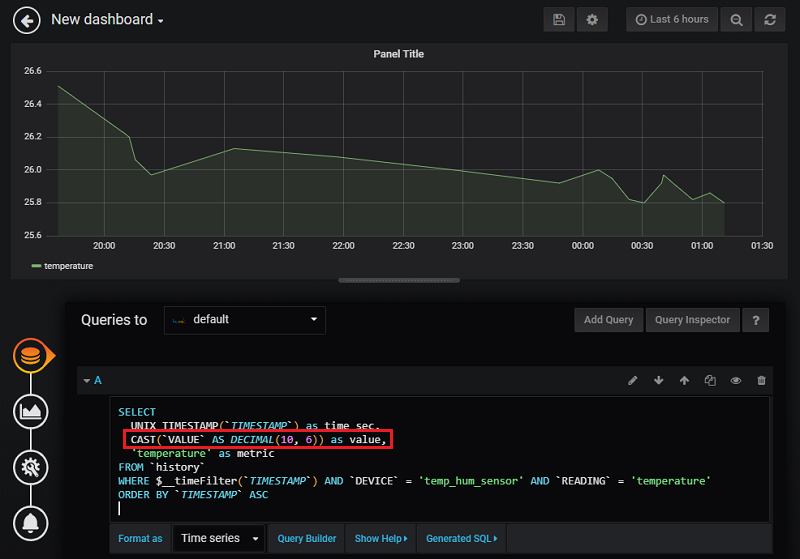
But we can re-write the SQL query using CAST to convert the data type of our VALUES to DECIMAL:
SELECT
  UNIX_TIMESTAMP(`TIMESTAMP`) as time_sec,
  CAST(`VALUE` AS DECIMAL(10, 6)) as value,
  'temperature' as metric
FROM `history`
WHERE $__timeFilter(`TIMESTAMP`) AND `DEVICE` = 'temp_hum_sensor' AND `READING` = 'temperature'
ORDER BY `TIMESTAMP` ASC
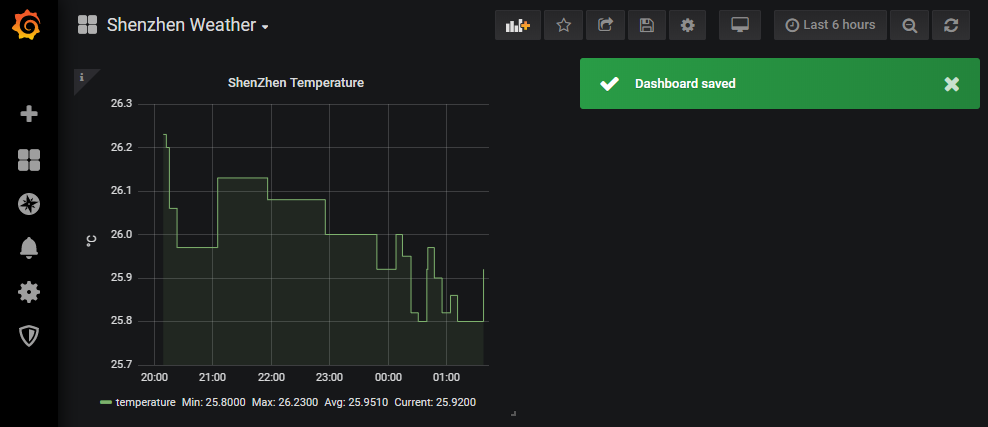
Continuing through the wizard on the left allows me to further customize the graph:
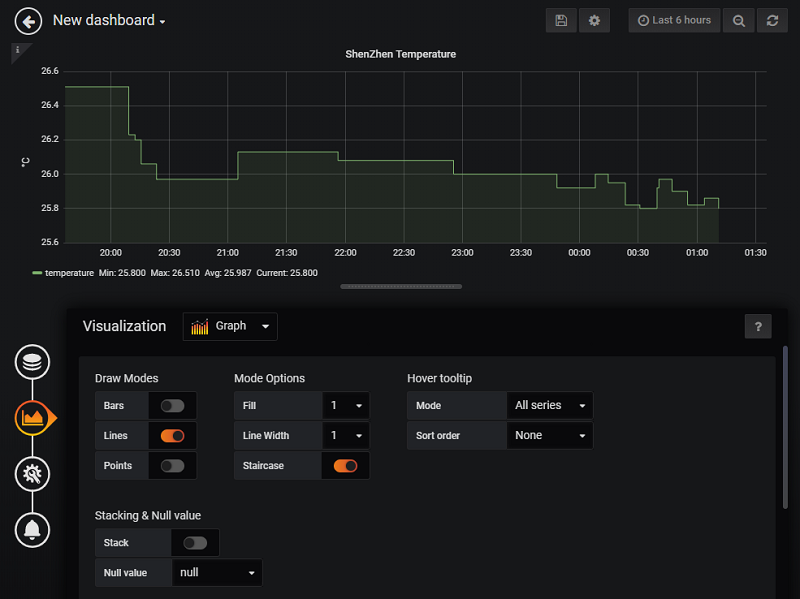
Now we can return to the home screen and save our first dashboard: