Loki - Promtail & Grafana for System Logs.

Loki is a horizontally-scalable, highly-available, multi-tenant log aggregation system inspired by Prometheus. It is designed to be very cost effective and easy to operate. It does not index the contents of the logs, but rather a set of labels for each log stream.
Installation with Docker
You can install Loki and Promtail with Docker or Docker Compose if you are evaluating, testing, or developing Loki.
Dry-run with Docker Compose
Run the following commands in your command line. They work for Windows or Linux systems.
wget https://raw.githubusercontent.com/grafana/loki/v2.3.0/production/docker-compose.yaml -O docker-compose.yaml

docker-compose -f docker-compose.yml up
nano /opt/loki/docker-compose.yml
version: "3"

networks:
  loki:

services:
  loki:
    image: grafana/loki:2.3.0
    ports:
      - "3100:3100"
    command: -config.file=/etc/loki/local-config.yaml
    networks:
      - loki

  promtail:
    image: grafana/promtail:2.3.0
    volumes:
      - /var/log:/var/log
    command: -config.file=/etc/promtail/config.yml
    networks:
      - loki

  grafana:
    image: grafana/grafana:latest
    ports:
      - "3000:3000"
    networks:
      - loki
Navigate to http://localhost:3100/metrics to view the metrics and http://localhost:3100/ready readiness of the Loki database.
The Docker-Compose file looks like:
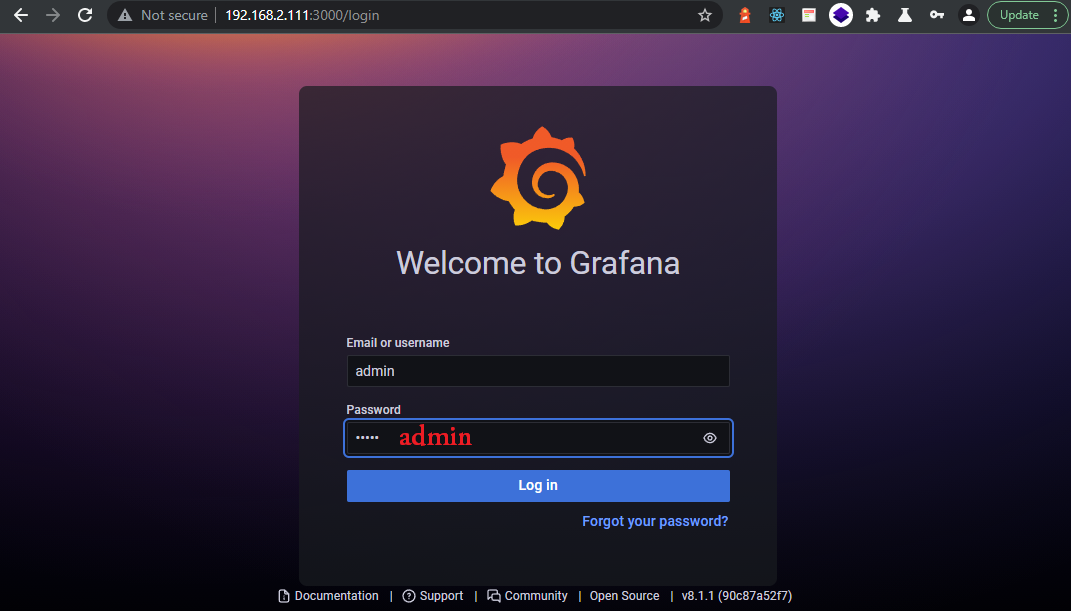
Now visit the server IP on Port 3000. Login with admin/admin, e.g.:
Ok - this worked - shut everything down with docker-compose down and going to the next step:
Configuring the Services
Promtail
Promtail - similar to Elastic Logstash - ingests log files for us and forwards them to our database Loki. We need to configure it to keep an eye on a specific log or a log directory. The official config example is:
server:
  http_listen_port: 9080
  grpc_listen_port: 0

positions:
  filename: /tmp/positions.yaml

clients:
  - url: http://localhost:3100/loki/api/v1/push

scrape_configs:
- job_name: system
  static_configs:
  - targets:
      - localhost
    labels:
      job: varlogs
      __path__: /var/log/*log
Which would keep an eye on our Linux system log directory. Since we are running the service inside a Docker container, we have to point Promtail to an internal directory and modify our docker-compose file to mount in the log file from our host system. The resulting configuration file looks like:
nano /opt/loki/config/promtail-config.yml
server:
  http_listen_port: 9080
  grpc_listen_port: 0

positions:
  filename: /tmp/positions.yaml

clients:
  - url: http://loki:3100/loki/api/v1/push

scrape_configs:
- job_name: nginx_log
  static_configs:
  - targets:
      - loki
    labels:
      job: varlogs
      __path__: /opt/nginx_access.log
The NGINX logfile is located in
/opt/loki/logs/nginx_access.logon my host and will be mounted to/opt/nginx_access.loginside the Promtail container by the Docker-Compose file below.
All the demo files I found online usually use the
localhost:3100URL - make sure to change this toloki:3100. We are running our setup in an virtual environment where docker provides a DNS service that allows us to resolve container names to their IP addresses inside the docker network.
Loki
For Loki I am going to use the default config you can download from Github:
In the downloaded version there was a path
/tmp/loki/rules-tempthat I had to replace with/loki/rules-tempfor this config to work.
nano /opt/loki/config/loki-config.yml
auth_enabled: false

server:
  http_listen_port: 3100
  grpc_listen_port: 9096

ingester:
  wal:
    enabled: true
    dir: /tmp/wal
  lifecycler:
    address: 127.0.0.1
    ring:
      kvstore:
        store: inmemory
      replication_factor: 1
    final_sleep: 0s
  chunk_idle_period: 1h       # Any chunk not receiving new logs in this time will be flushed
  max_chunk_age: 1h           # All chunks will be flushed when they hit this age, default is 1h
  chunk_target_size: 1048576  # Loki will attempt to build chunks up to 1.5MB, flushing first if chunk_idle_period or max_chunk_age is reached first
  chunk_retain_period: 30s    # Must be greater than index read cache TTL if using an index cache (Default index read cache TTL is 5m)
  max_transfer_retries: 0     # Chunk transfers disabled

schema_config:
  configs:
    - from: 2020-10-24
      store: boltdb-shipper
      object_store: filesystem
      schema: v11
      index:
        prefix: index_
        period: 24h

storage_config:
  boltdb_shipper:
    active_index_directory: /tmp/loki/boltdb-shipper-active
    cache_location: /tmp/loki/boltdb-shipper-cache
    cache_ttl: 24h         # Can be increased for faster performance over longer query periods, uses more disk space
    shared_store: filesystem
  filesystem:
    directory: /tmp/loki/chunks

compactor:
  working_directory: /tmp/loki/boltdb-shipper-compactor
  shared_store: filesystem

limits_config:
  reject_old_samples: true
  reject_old_samples_max_age: 168h

chunk_store_config:
  max_look_back_period: 0s

table_manager:
  retention_deletes_enabled: false
  retention_period: 0s

ruler:
  storage:
    type: local
    local:
      directory: /tmp/loki/rules
  rule_path: /loki/rules-temp
  alertmanager_url: http://localhost:9093
  ring:
    kvstore:
      store: inmemory
  enable_api: true
Docker Compose
Now we need to make sure that those configuration files and logs are mounted into the correct containers:
version: "3"

networks:
  loki:

services:
  loki:
    image: grafana/loki:2.3.0
    volumes:
      - /opt/loki/config/loki-config.yml:/etc/loki/loki-config.yml
    ports:
      - "3100:3100"
    command: -config.file=/etc/loki/loki-config.yml
    networks:
      - loki

  promtail:
    image: grafana/promtail:2.3.0
    volumes:
      - /opt/loki/config/promtail-config.yml:/etc/promtail/promtail-config.yml
      - /opt/loki/logs/nginx_access.log:/opt/nginx_access.log
    command: -config.file=/etc/promtail/promtail-config.yml
    networks:
      - loki

  grafana:
    image: grafana/grafana:latest
    ports:
      - "3000:3000"
    networks:
      - loki
Starting the Loki Environment
Configure Data Source
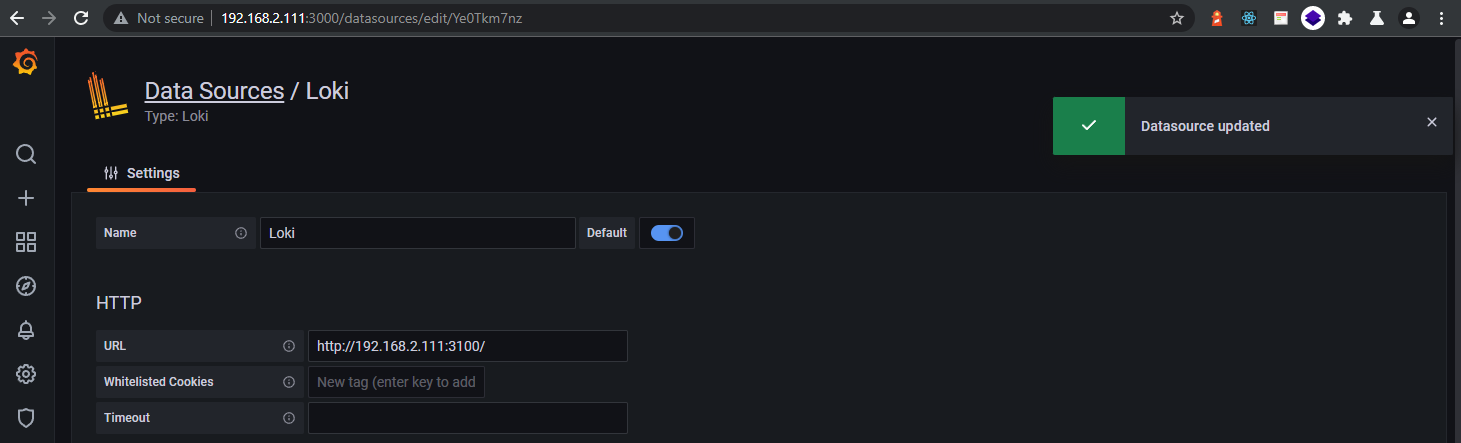
Head over to Configuration/Data sources and select to add a new Loki Data Source:
The online documentation I found usually used
localhost:3100. But since I am accessing from a different system, I have to use the server IP address instead.192.168.2.111:3000
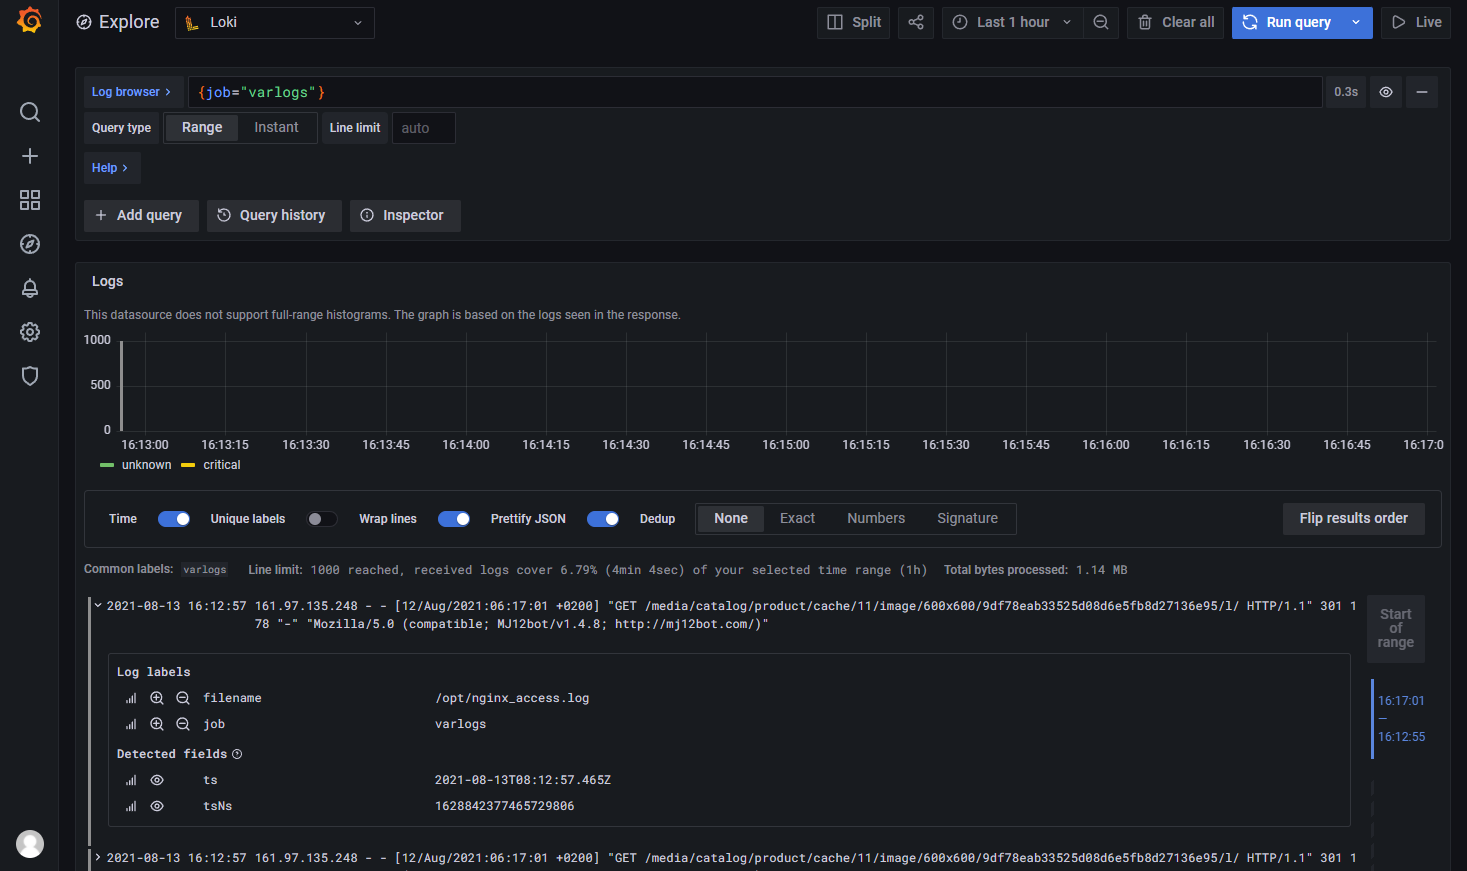
Now switch to the Explore tab and follow the help to come up with some queries - e.g. {job="varlogs"} - varlogs is the label we assigned to our job in promtail-config.yml:
Running the query will show the NGINX log data that I had Promtail load into Loki: