Plotly COVID19 Dataset Exploration
Covid 19 :: Preprocessed Dataset
Johns Hopkins University Center for Systems Science and Engineering - COVID 19 Dataset preprocessed by @laxmimerit.
Coronavirus disease 2019 (COVID-19) time series listing confirmed cases, reported deaths and reported recoveries. Data is disaggregated by country (and sometimes subregion). Coronavirus disease (COVID-19) is caused by the Severe acute respiratory syndrome Coronavirus 2 (SARS-CoV-2) and has had a worldwide effect. On March 11 2020, the World Health Organization (WHO) declared it a pandemic, pointing to the over 118,000 cases of the coronavirus illness in over 110 countries and territories around the world at the time.
import plotly.express as px
import plotly.graph_objects as go
import plotly.figure_factory as ff
from plotly.subplots import make_subplots

import pandas as pd
import numpy as np
import matplotlib.pyplot as plt

import math
import random
from datetime import datetime

# color palette
cnf='#393e46'
dth='#ff2e63'
rec='#21bf73'
act='#fe9801'
import plotly as py
py.offline.init_notebook_mode(connected=True)
Datasets
!wget https://github.com/laxmimerit/Covid-19-Preprocessed-Dataset/raw/main/preprocessed/country_daywise.csv -P datasets
!wget https://github.com/laxmimerit/Covid-19-Preprocessed-Dataset/raw/main/preprocessed/daywise.csv -P datasets
!wget https://github.com/laxmimerit/Covid-19-Preprocessed-Dataset/raw/main/preprocessed/covid_19_data_cleaned.csv -P datasets
!wget https://github.com/laxmimerit/Covid-19-Preprocessed-Dataset/raw/main/preprocessed/countrywise.csv -P datasets
df_data_clean = pd.read_csv('datasets/covid_19_data_cleaned.csv', parse_dates=['Date'])
df_data_clean['Province/State'] = df_data_clean['Province/State'].fillna('')
df_data_clean.tail(5)
| Date | Province/State | Country | Lat | Long | Confirmed | Recovered | Deaths | Active | |
|---|---|---|---|---|---|---|---|---|---|
| 337180 | 2023-03-05 | Timor-Leste | -8.8742 | 125.7275 | 0 | 0 | 0 | 0 | |
| 337181 | 2023-03-06 | Timor-Leste | -8.8742 | 125.7275 | 0 | 0 | 0 | 0 | |
| 337182 | 2023-03-07 | Timor-Leste | -8.8742 | 125.7275 | 0 | 0 | 0 | 0 | |
| 337183 | 2023-03-08 | Timor-Leste | -8.8742 | 125.7275 | 0 | 0 | 0 | 0 | |
| 337184 | 2023-03-09 | Timor-Leste | -8.8742 | 125.7275 | 0 | 0 | 0 | 0 |
df_data_country_daywise = pd.read_csv('datasets/country_daywise.csv', parse_dates=['Date'])
df_data_country_daywise.tail(5)
| Date | Country | Confirmed | Deaths | Recovered | Active | New Cases | New Recovered | New Deaths | |
|---|---|---|---|---|---|---|---|---|---|
| 229135 | 2023-03-03 | Zimbabwe | 264127 | 5668 | 0 | 258459 | 0 | 0 | 0 |
| 229136 | 2023-03-04 | Zimbabwe | 264127 | 5668 | 0 | 258459 | 0 | 0 | 0 |
| 229137 | 2023-03-05 | Zimbabwe | 264127 | 5668 | 0 | 258459 | 0 | 0 | 0 |
| 229138 | 2023-03-06 | Zimbabwe | 264127 | 5668 | 0 | 258459 | 0 | 0 | 0 |
| 229139 | 2023-03-07 | Zimbabwe | 264127 | 5668 | 0 | 258459 | 0 | 0 | 0 |
df_data_daywise = pd.read_csv('datasets/daywise.csv', parse_dates=['Date'])
df_data_daywise.tail(5)
| Date | Confirmed | Deaths | Recovered | Active | New Cases | Deaths / 100 Cases | Recovered / 100 Cases | Deaths / 100 Recovered | No. of Countries | |
|---|---|---|---|---|---|---|---|---|---|---|
| 1135 | 2023-03-03 | 675914580 | 6877325 | 0 | 669037255 | 182669 | 1.02 | 0.0 | inf | 201 |
| 1136 | 2023-03-04 | 675968775 | 6877601 | 0 | 669091174 | 54195 | 1.02 | 0.0 | inf | 201 |
| 1137 | 2023-03-05 | 676024901 | 6877749 | 0 | 669147152 | 59988 | 1.02 | 0.0 | inf | 201 |
| 1138 | 2023-03-06 | 676082941 | 6878115 | 0 | 669204826 | 63196 | 1.02 | 0.0 | inf | 201 |
| 1139 | 2023-03-07 | 676213378 | 6879038 | 0 | 669334340 | 130437 | 1.02 | 0.0 | inf | 201 |
df_data_countrywise = pd.read_csv('datasets/countrywise.csv')
df_data_countrywise.tail(5)
| Country | Confirmed | Deaths | Recovered | Active | New Cases | Deaths / 100 Cases | Recovered / 100 Cases | Deaths / 100 Recovered | Population | Cases / Million People | Confirmed last week | 1 week change | 1 week % increase | |
|---|---|---|---|---|---|---|---|---|---|---|---|---|---|---|
| 196 | West Bank and Gaza | 703228 | 5708 | 0 | 697520 | 0 | 0.81 | 0.0 | 0.0 | 4543126 | 154789.000000 | 703228 | 0 | 0.00 |
| 197 | Winter Olympics 2022 | 535 | 0 | 0 | 535 | 0 | 0.00 | 0.0 | 0.0 | 0 | 155266.969388 | 535 | 0 | 0.00 |
| 198 | Yemen | 11945 | 2159 | 0 | 9786 | 0 | 18.07 | 0.0 | 0.0 | 29825968 | 400.000000 | 11945 | 0 | 0.00 |
| 199 | Zambia | 343135 | 4057 | 0 | 339078 | 0 | 1.18 | 0.0 | 0.0 | 18383956 | 18665.000000 | 343012 | 123 | 0.04 |
| 200 | Zimbabwe | 264127 | 5668 | 0 | 258459 | 0 | 2.15 | 0.0 | 0.0 | 14862927 | 17771.000000 | 263921 | 206 | 0.08 |
Exploration
df_data_clean.isnull().sum()
| Date | 0 |
|---|---|
| Province/State | 0 |
| Country | 0 |
| Lat | 0 |
| Long | 0 |
| Confirmed | 0 |
| Recovered | 0 |
| Deaths | 0 |
| Active | 0 |
| dtype: int64 |
df_data_clean.info()
df_data_clean.query('Country == "China"')
| Date | Province/State | Country | Lat | Long | Confirmed | Recovered | Deaths | Active | |
|---|---|---|---|---|---|---|---|---|---|
| 67437 | 2020-01-22 | Anhui | China | 31.8257 | 117.2264 | 1 | 0 | 0 | 1 |
| 67438 | 2020-01-23 | Anhui | China | 31.8257 | 117.2264 | 9 | 0 | 0 | 9 |
| 67439 | 2020-01-24 | Anhui | China | 31.8257 | 117.2264 | 15 | 0 | 0 | 15 |
| 67440 | 2020-01-25 | Anhui | China | 31.8257 | 117.2264 | 39 | 0 | 0 | 39 |
| 67441 | 2020-01-26 | Anhui | China | 31.8257 | 117.2264 | 60 | 0 | 0 | 60 |
| ... | |||||||||
| 333751 | 2023-03-05 | Henan | China | 33.8820 | 113.6140 | 0 | 0 | 0 | 0 |
| 333752 | 2023-03-06 | Henan | China | 33.8820 | 113.6140 | 0 | 0 | 0 | 0 |
| 333753 | 2023-03-07 | Henan | China | 33.8820 | 113.6140 | 0 | 0 | 0 | 0 |
| 333754 | 2023-03-08 | Henan | China | 33.8820 | 113.6140 | 0 | 0 | 0 | 0 |
| 333755 | 2023-03-09 | Henan | China | 33.8820 | 113.6140 | 0 | 0 | 0 | 0 |
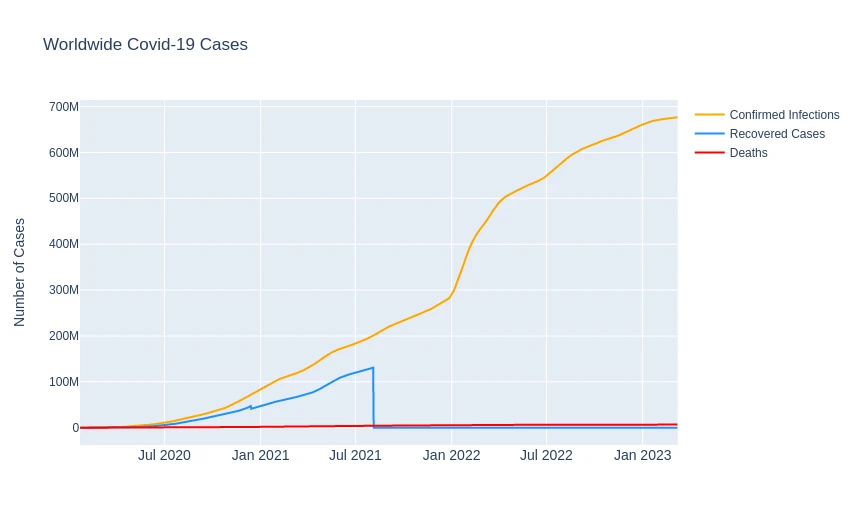
Worldwide Covid-19 Cases
confirmed_infections = df_data_clean.groupby('Date').sum(numeric_only=True)['Confirmed'].reset_index()
confirmed_infections.tail(5)
Confirmed Infection Cases
| Date | Confirmed | |
|---|---|---|
| 0 | 2020-01-22 | 557 |
| 1 | 2020-01-23 | 657 |
| 2 | 2020-01-24 | 944 |
| 3 | 2020-01-25 | 1437 |
| 4 | 2020-01-26 | 2120 |
| ... | ||
| 1138 | 2023-03-05 | 676024901 |
| 1139 | 2023-03-06 | 676082941 |
| 1140 | 2023-03-07 | 676213378 |
| 1141 | 2023-03-08 | 676392824 |
| 1142 | 2023-03-09 | 676570149 |
| 1143 rows × 2 columns |
recovered_cases = df_data_clean.groupby('Date').sum(numeric_only=True)['Recovered'].reset_index()
recovered_cases.tail(5)
Recovered Cases
| Date | Recovered | |
|---|---|---|
| 0 | 2020-01-22 | 30 |
| 1 | 2020-01-23 | 32 |
| 2 | 2020-01-24 | 39 |
| 3 | 2020-01-25 | 42 |
| 4 | 2020-01-26 | 56 |
| ... | ||
| 1138 | 2023-03-05 | 0 |
| 1139 | 2023-03-06 | 0 |
| 1140 | 2023-03-07 | 0 |
| 1141 | 2023-03-08 | 0 |
| 1142 | 2023-03-09 | 0 |
| 1143 rows × 2 columns |
deaths = df_data_clean.groupby('Date').sum(numeric_only=True)['Deaths'].reset_index()
deaths.tail(5)
Deaths
| Date | Deaths | |
|---|---|---|
| Date | Deaths | |
| 1138 | 2023-03-05 | 6877749 |
| 1139 | 2023-03-06 | 6878115 |
| 1140 | 2023-03-07 | 6879038 |
| 1141 | 2023-03-08 | 6880483 |
| 1142 | 2023-03-09 | 6881802 |
fig = go.Figure()
fig.update_layout(
    title='Worldwide Covid-19 Cases',
    xaxis_tickfont_size=14,
    yaxis=dict(title='Number of Cases')
)

fig.add_trace(go.Scatter(
    x=confirmed_infections['Date'],
    y=confirmed_infections['Confirmed'],
    mode='lines',
    name='Confirmed Infections',
    line=dict(color='orange', width=2),
))

fig.add_trace(go.Scatter(
    x=recovered_cases['Date'],
    y=recovered_cases['Recovered'],
    mode='lines',
    name='Recovered Cases',
    line=dict(color='dodgerblue', width=2),
))

fig.add_trace(go.Scatter(
    x=deaths['Date'],
    y=deaths['Deaths'],
    mode='lines',
    name='Deaths',
    line=dict(color='red', width=2),
))

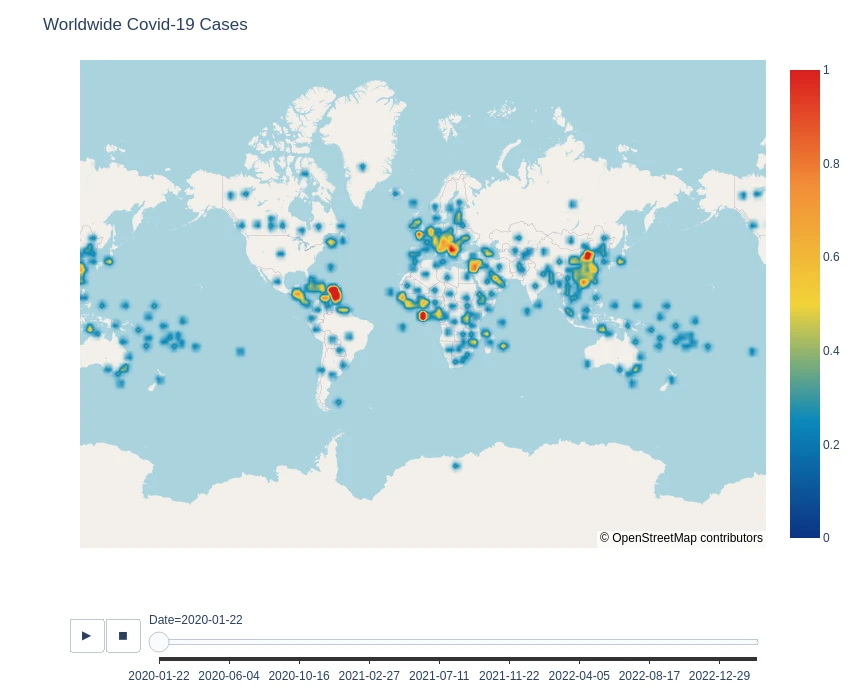
Worldwide Case Density
df_data_clean['Date'] = df_data_clean['Date'].astype(str)
fig = px.density_mapbox(
    data_frame=df_data_clean,
    lat='Lat',
    lon='Long',
    hover_name='Country',
    hover_data=['Confirmed', 'Recovered', 'Deaths'],
    animation_frame='Date',
    color_continuous_scale='Portland',
    radius=7,
    zoom=0,
    height=700
)

fig.update_layout(
    mapbox_style="open-street-map",
    title='Worldwide Covid-19 Cases',
    mapbox_center_lon=0
)

fig.show()

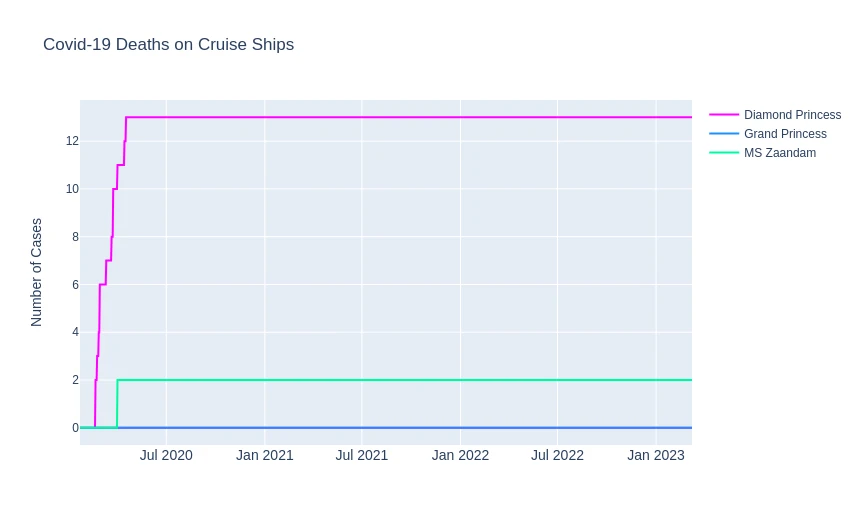
Cruising Corona
df_data_clean['Date'] = pd.to_datetime(df_data_clean['Date'])
cruise_ships_diamond = df_data_clean[
    'Province/State'
].str.contains(
    'Grand Princess'
) | df_data_clean[
    'Country'
].str.contains(
    'Diamond Princess'
)

cruise_ships_grand = df_data_clean[
    'Province/State'
].str.contains(
    'Grand Princess'
) | df_data_clean[
    'Country'
].str.contains(
    'Grand Princess'
)

cruise_ships_zaandam = df_data_clean[
    'Country'
].str.contains(
    'MS Zaandam'
)

cruise_df_diamond = df_data_clean[cruise_ships_diamond]
cruise_ships_grand = df_data_clean[cruise_ships_grand]
cruise_df_zaandam = df_data_clean[cruise_ships_zaandam]
cruise_df_zaandam
| Date | Province/State | Country | Lat | Long | Confirmed | Recovered | Deaths | Active | |
|---|---|---|---|---|---|---|---|---|---|
| 200025 | 2020-01-22 | MS Zaandam | 0.0 | 0.0 | 0 | 0 | 0 | 0 | |
| 200026 | 2020-01-23 | MS Zaandam | 0.0 | 0.0 | 0 | 0 | 0 | 0 | |
| 200027 | 2020-01-24 | MS Zaandam | 0.0 | 0.0 | 0 | 0 | 0 | 0 | |
| 200028 | 2020-01-25 | MS Zaandam | 0.0 | 0.0 | 0 | 0 | 0 | 0 | |
| 200029 | 2020-01-26 | MS Zaandam | 0.0 | 0.0 | 0 | 0 | 0 | 0 | |
| ... | |||||||||
| 201163 | 2023-03-05 | MS Zaandam | 0.0 | 0.0 | 9 | 0 | 2 | 7 | |
| 201164 | 2023-03-06 | MS Zaandam | 0.0 | 0.0 | 9 | 0 | 2 | 7 | |
| 201165 | 2023-03-07 | MS Zaandam | 0.0 | 0.0 | 9 | 0 | 2 | 7 | |
| 201166 | 2023-03-08 | MS Zaandam | 0.0 | 0.0 | 9 | 0 | 2 | 7 | |
| 201167 | 2023-03-09 | MS Zaandam | 0.0 | 0.0 | 9 | 0 | 2 | 7 | |
| 1143 rows × 9 columns |
fig = go.Figure()
fig.update_layout(
    title='Covid-19 Deaths on Cruise Ships',
    xaxis_tickfont_size=14,
    yaxis=dict(title='Number of Cases')
)

fig.add_trace(go.Scatter(
    x=cruise_df_diamond['Date'],
    y=cruise_df_diamond['Deaths'],
    mode='lines',
    name='Diamond Princess',
    line=dict(color='fuchsia', width=2),
))

fig.add_trace(go.Scatter(
    x=cruise_ships_grand['Date'],
    y=cruise_ships_grand['Deaths'],
    mode='lines',
    name='Grand Princess',
    line=dict(color='dodgerblue', width=2),
))

fig.add_trace(go.Scatter(
    x=cruise_df_zaandam['Date'],
    y=cruise_df_zaandam['Deaths'],
    mode='lines',
    name='MS Zaandam',
    line=dict(color='mediumspringgreen', width=2),
))

time_plot_df = df_data_clean.groupby(
    'Date'
)[[
    'Confirmed',
    'Deaths',
    'Recovered',
    'Active'
]].sum(numeric_only=True).reset_index()

time_plot_df.head(5)
| Date | Confirmed | Deaths | Recovered | Active | |
|---|---|---|---|---|---|
| 0 | 2020-01-22 | 557 | 17 | 30 | 510 |
| 1 | 2020-01-23 | 657 | 18 | 32 | 607 |
| 2 | 2020-01-24 | 944 | 26 | 39 | 879 |
| 3 | 2020-01-25 | 1437 | 42 | 42 | 1353 |
| 4 | 2020-01-26 | 2120 | 56 | 56 | 2008 |
# get latest
latest_values = time_plot_df[time_plot_df['Date']==max(time_plot_df['Date'])].reset_index(drop=True)
latest_values
| Date | Confirmed | Deaths | Recovered | Active | |
|---|---|---|---|---|---|
| 0 | 2023-03-09 | 676570149 | 6881802 | 0 | 669688347 |
tp_df = time_plot_df.melt(id_vars='Date', value_vars=['Active', 'Deaths', 'Recovered'])

fig = px.treemap(
    tp_df,
    path=['variable'],
    values='value',
    height=250,
    width=800,
    color_discrete_sequence=[act, rec, dth]
)

fig.data[0].textinfo = 'label+text+value'
fig.show()
tp_df = time_plot_df.melt(
    id_vars='Date',
    value_vars=['Active', 'Deaths', 'Recovered'],
    var_name='Case',
    value_name='Count'
)

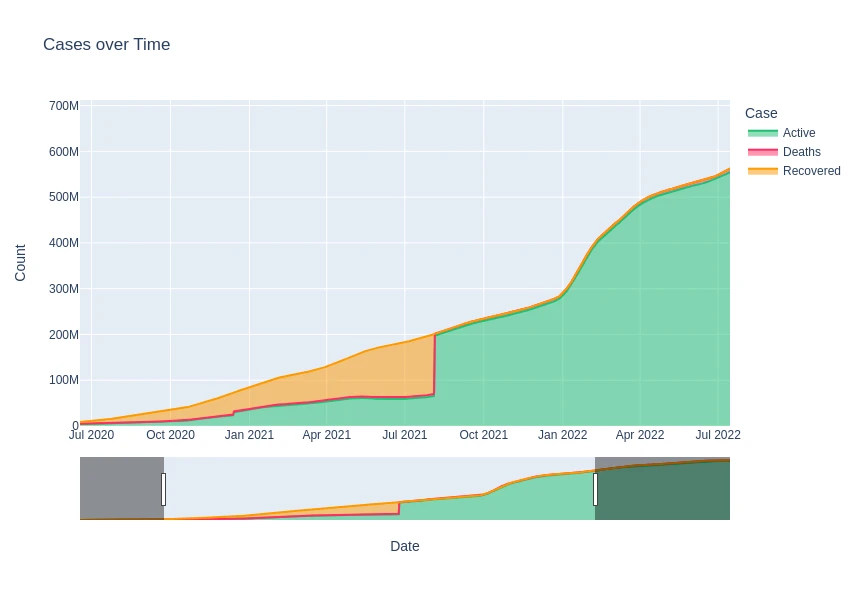
fig = px.area(
    tp_df,
    x='Date',
    y='Count',
    color='Case',
    height=600,
    title='Cases over Time',
    color_discrete_sequence=[rec, dth, act]
)

fig.update_layout(
    xaxis_rangeslider_visible=True
)

fig.show()
