Seaborn Titanic Dataset Exploration
import numpy as np
import matplotlib.pyplot as plt
import pandas as pd
import seaborn as sns
Dataset
titanic_df = sns.load_dataset('titanic')
titanic_df.head(3).transpose()
| 0 | 1 | 2 | |
|---|---|---|---|
| survived | 0 | 1 | 1 |
| pclass | 3 | 1 | 3 |
| sex | male | female | female |
| age | 22.0 | 38.0 | 26.0 |
| sibsp | 1 | 1 | 0 |
| parch | 0 | 0 | 0 |
| fare | 7.25 | 71.2833 | 7.925 |
| embarked | S | C | S |
| class | Third | First | Third |
| who | man | woman | woman |
| adult_male | True | False | False |
| deck | NaN | C | NaN |
| embark_town | Southampton | Cherbourg | Southampton |
| alive | no | yes | yes |
| alone | False | False | True |
titanic_df.info()
RangeIndex: 891 entries, 0 to 890
Data columns (total 15 columns):
 #   Column       Non-Null Count  Dtype
---  ------       --------------  -----
 0   survived     891 non-null    int64
 1   pclass       891 non-null    int64
 2   sex          891 non-null    object
 3   age          714 non-null    float64
 4   sibsp        891 non-null    int64
 5   parch        891 non-null    int64
 6   fare         891 non-null    float64
 7   embarked     889 non-null    object
 8   class        891 non-null    category
 9   who          891 non-null    object
 10  adult_male   891 non-null    bool
 11  deck         203 non-null    category
 12  embark_town  889 non-null    object
 13  alive        891 non-null    object
 14  alone        891 non-null    bool
dtypes: bool(2), category(2), float64(2), int64(4), object(5)
memory usage: 80.7+ KB
plt.rcParams['figure.figsize'] = [10,5]
plt.style.use('ggplot')
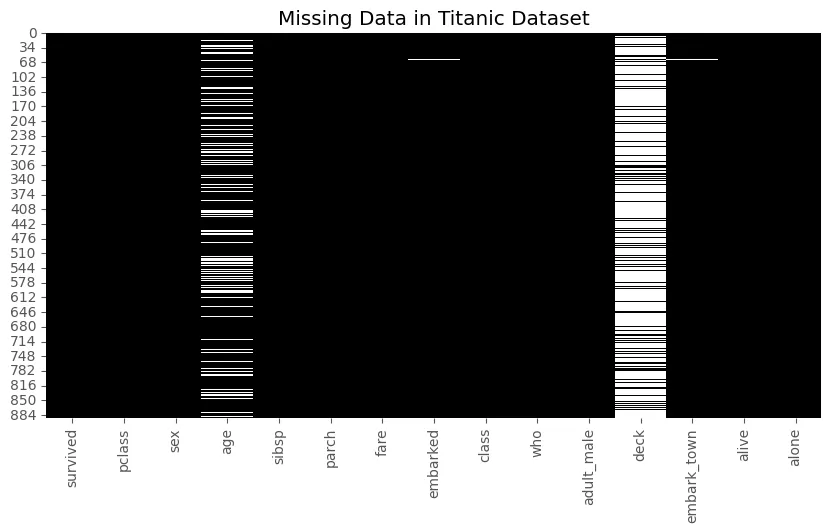
Missing Data
titanic_df.isnull().sum()
| survived | 0 |
| pclass | 0 |
| sex | 0 |
| age | 177 |
| sibsp | 0 |
| parch | 0 |
| fare | 0 |
| embarked | 2 |
| class | 0 |
| who | 0 |
| adult_male | 0 |
| deck | 688 |
| embark_town | 2 |
| alive | 0 |
| alone | 0 |
| dtype: int64 |
colour_map = ['black', 'white']

sns.heatmap(
    titanic_df.isnull(),
    cmap=colour_map,
    cbar=False
).set_title('Missing Data in Titanic Dataset')

plt.savefig('../assets/Titanic_Dataset_Exploration_00.webp', bbox_inches='tight')
titanic_df_cleaned = titanic_df.drop(['age', 'deck'], axis=1)
titanic_df_drop_na = titanic_df_cleaned.dropna(subset=['embarked', 'embark_town'])
titanic_df_drop_na.isnull().sum()
| survived | 0 |
| pclass | 0 |
| sex | 0 |
| sibsp | 0 |
| parch | 0 |
| fare | 0 |
| embarked | 0 |
| class | 0 |
| who | 0 |
| adult_male | 0 |
| embark_town | 0 |
| alive | 0 |
| alone | 0 |
| dtype: int64 |
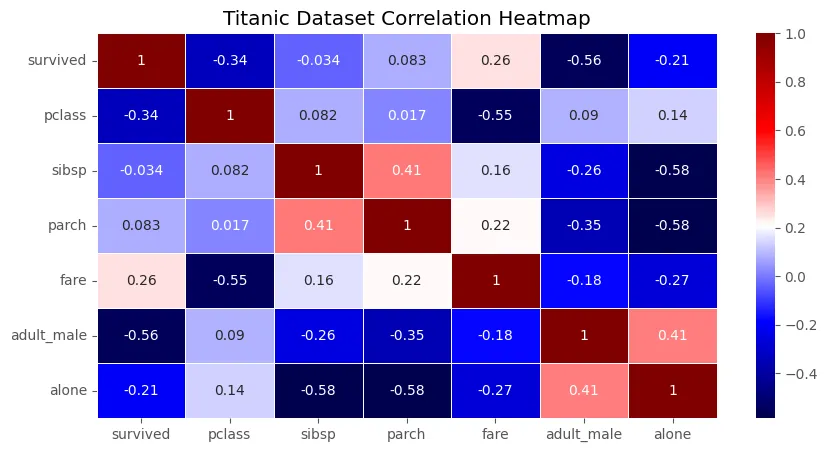
Data Correlation Matrix
sns.heatmap(
    titanic_df_drop_na.corr(numeric_only=True),
    linewidth=0.5,
    cmap='seismic',
    annot=True
).set_title('Titanic Dataset Correlation Heatmap')

plt.savefig('../assets/Titanic_Dataset_Exploration_01.webp', bbox_inches='tight')
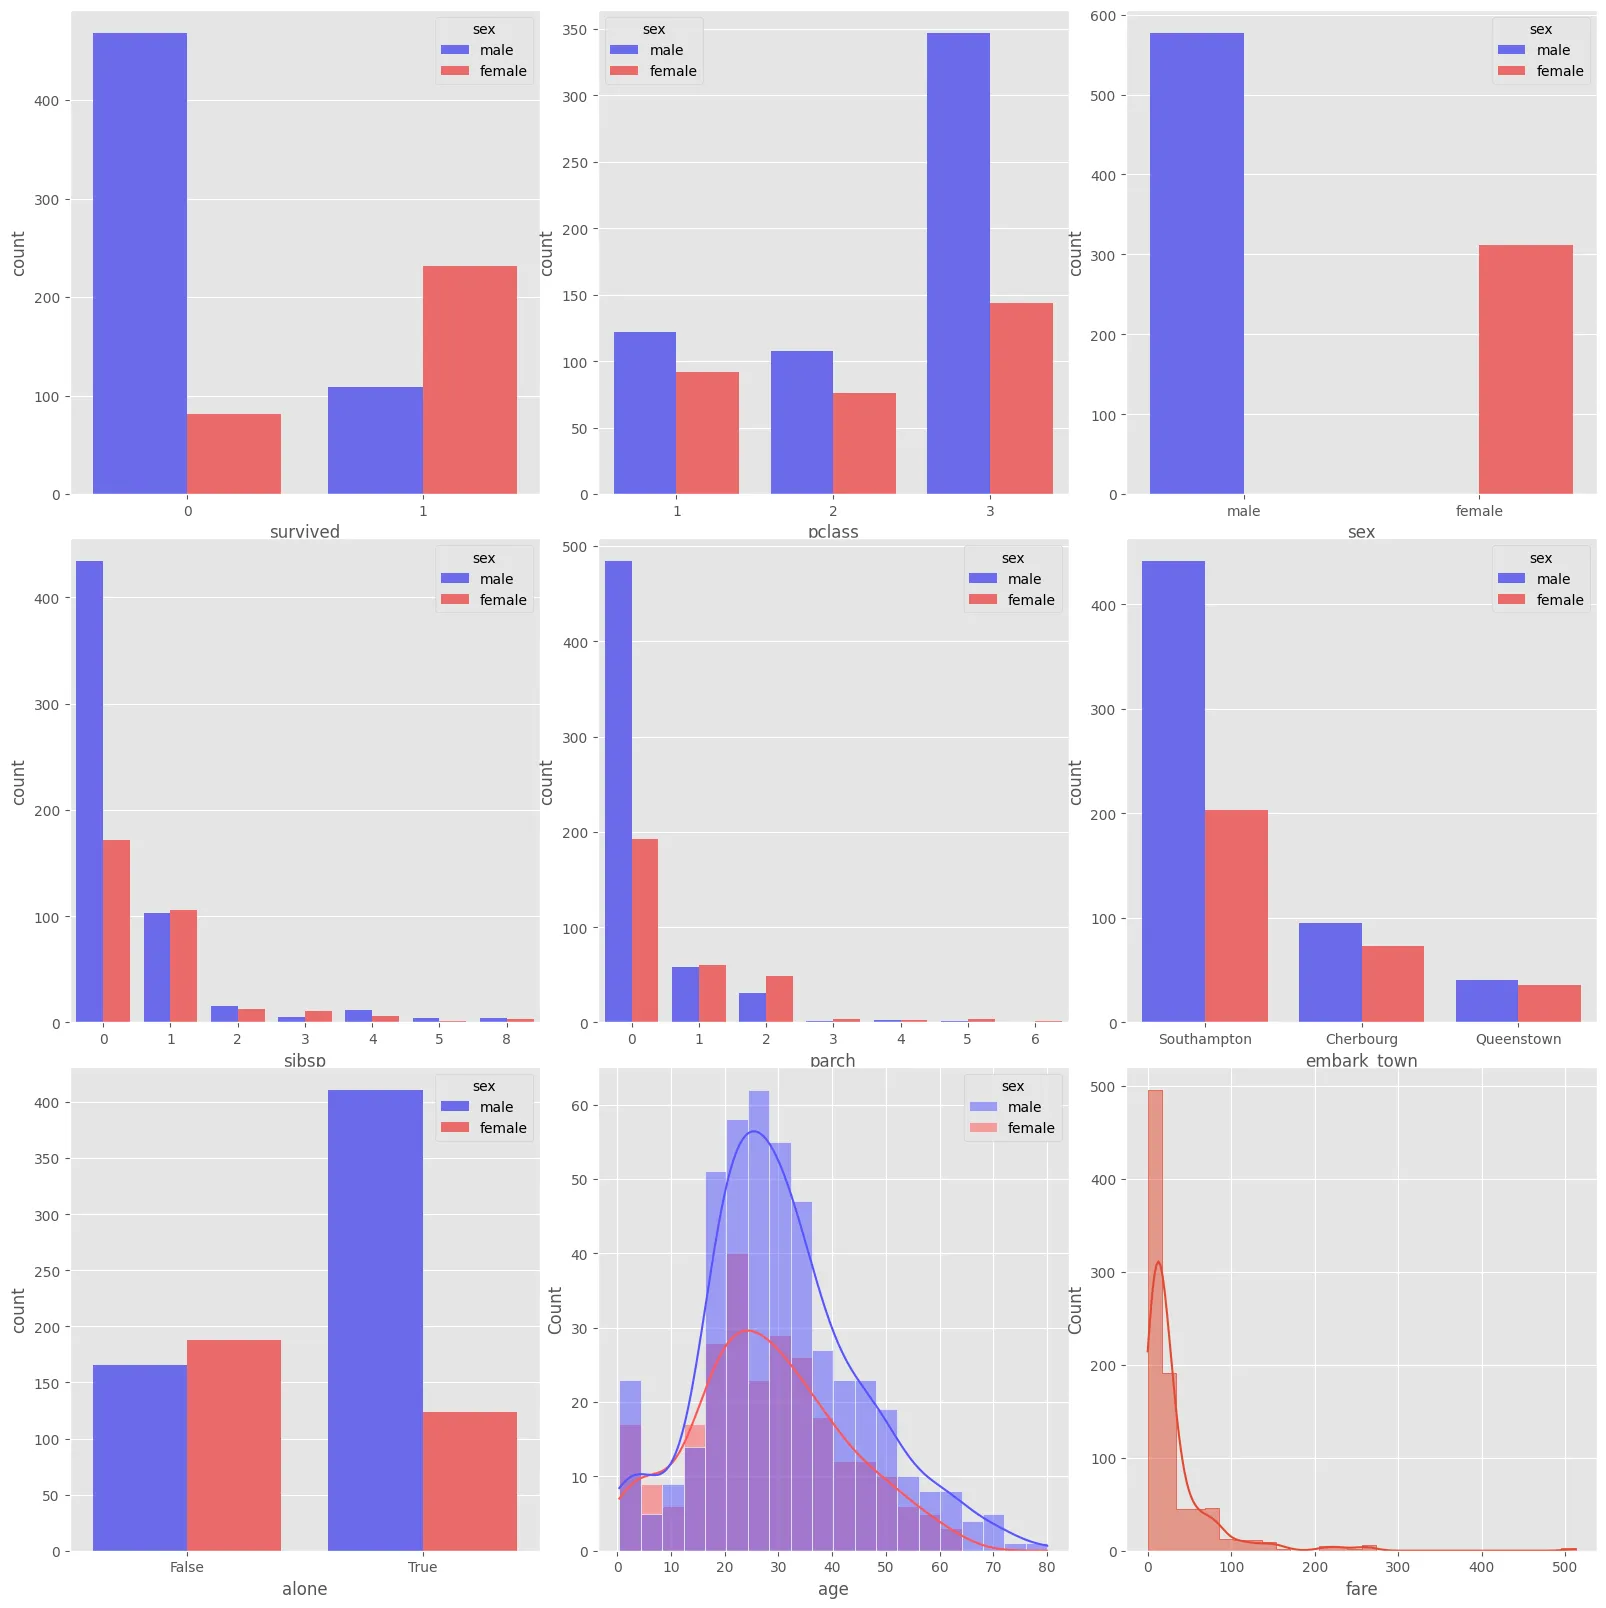
Multivariant Analysis
fig, ax = plt.subplots(3, 3, figsize=(16,16))

plt.tight_layout()

# categorical plots
sns.countplot(
    data=titanic_df_drop_na,
    x='survived',
    hue='sex',
    palette='seismic',
    ax=ax[0,0]
)

sns.countplot(
    data=titanic_df_drop_na,
    x='pclass',
    hue='sex',
    palette='seismic',
    ax=ax[0,1]
)

sns.countplot(
    data=titanic_df_drop_na,
    x='sex',
    hue='sex',
    palette='seismic',
    ax=ax[0,2]
)

sns.countplot(
    data=titanic_df_drop_na,
    x='sibsp',
    hue='sex',
    palette='seismic',
    ax=ax[1,0]
)

sns.countplot(
    data=titanic_df_drop_na,
    x='parch',
    hue='sex',
    palette='seismic',
    ax=ax[1,1]
)

sns.countplot(
    data=titanic_df_drop_na,
    x='embark_town',
    hue='sex',
    palette='seismic',
    ax=ax[1,2]
)

sns.countplot(
    data=titanic_df_drop_na,
    x='alone',
    hue='sex',
    palette='seismic',
    ax=ax[2,0]
)

sns.histplot(
    data=titanic_df,
    kde=True,
    x='age',
    hue='sex',
    palette='seismic',
    ax=ax[2,1]
)

# numeric plots
sns.histplot(
    titanic_df_drop_na['fare'],
    bins=30,
    element='step',
    kde=True,
    ax=ax[2][2]
)

plt.savefig('../assets/Titanic_Dataset_Exploration_02.webp', bbox_inches='tight')
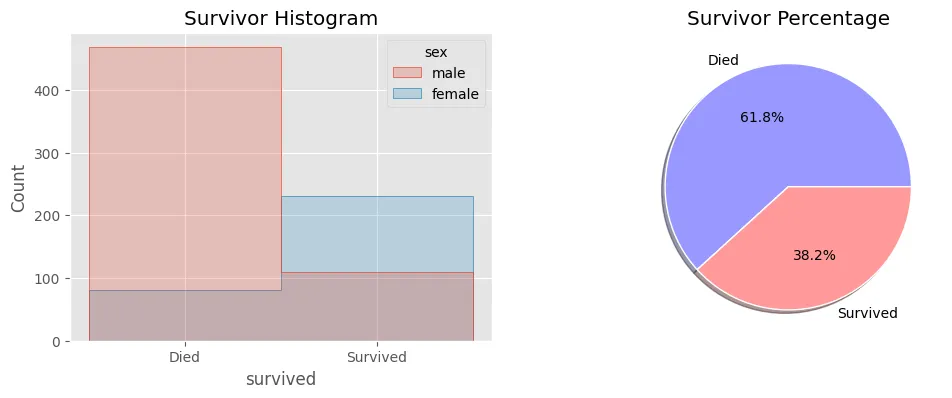
Number of Survivors
titanic_df_drop_na['survived'].value_counts()
| 0 | 549 |
| 1 | 340 |
| Name: survived, dtype: int64 |
def string_categories(survival):
    if survival == 0:
        return 'Died'
    else:
        return 'Survived'

titanic_df_drop_na['survived'] = titanic_df_drop_na['survived'].apply(string_categories)
sns.countplot(
    data=titanic_df_drop_na,
    x='survived',
    hue='sex',
    palette='seismic'
)

plt.title('Titanic Survivors Count')
plt.xlabel('Survivors')
plt.ylabel('Count')
plt.legend()

plt.savefig('../assets/Titanic_Dataset_Exploration_03.webp', bbox_inches='tight')

colors = plt.get_cmap('seismic')(np.linspace(0.4, 0.6, 2))
pie_labels = ['Died', 'Survived']

fig, axes = plt.subplots(1, 2, sharex=False, figsize=(12,4))
# fig.suptitle('Super Title')

sns.histplot(
    data=titanic_df_drop_na,
    x='survived',
    bins=45,
    element='step',
    hue='sex',
    ax=axes[0]
)
axes[0].set_title('Survivor Histogram')

axes[1].pie(
    titanic_df_drop_na['survived'].value_counts(),
    autopct='%1.1f%%',
    pctdistance=0.6,
    labels = pie_labels,
    colors=colors,
    wedgeprops={"linewidth": 1, "edgecolor": "white"},
    shadow=True,
)
axes[1].set_title('Survivor Percentage')

plt.savefig('../assets/Titanic_Dataset_Exploration_04.webp', bbox_inches='tight')
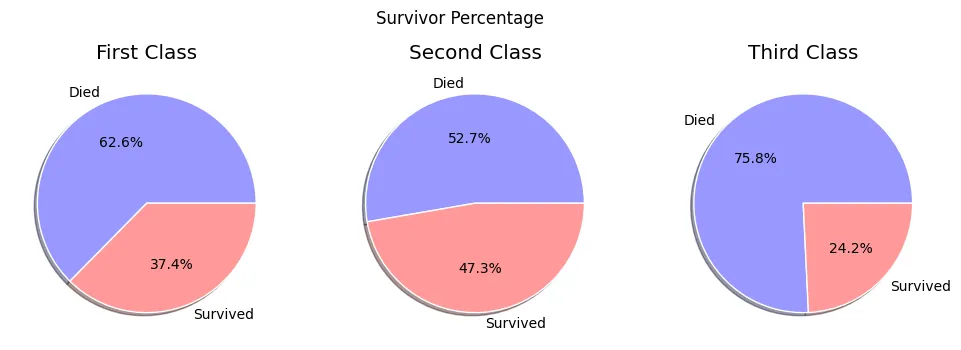
Passengers by Class
titanic_df_drop_na['pclass'].value_counts()
| 3 | 491 |
| 1 | 214 |
| 2 | 184 |
| Name: pclass, dtype: int64 |
titanic_df_drop_na.groupby(['pclass', 'survived'])['survived'].count()
| pclass | survived | |
|---|---|---|
| 1 | Died | 80 |
| Survived | 134 | |
| 2 | Died | 97 |
| Survived | 87 | |
| 3 | Died | 372 |
| Survived | 119 | |
| Name: survived, dtype: int64 |
sns.countplot(
    data=titanic_df_drop_na,
    x='pclass',
    hue='survived',
    palette='seismic'
)

plt.title('Survivors by Passengers Class')
plt.xlabel('Passenger Class')
plt.ylabel('Count')

plt.savefig('../assets/Titanic_Dataset_Exploration_05.webp', bbox_inches='tight')

# break down dataframe by classes
titanic_df_first_class = titanic_df_drop_na[titanic_df_drop_na['pclass'] == 1]
titanic_df_second_class = titanic_df_drop_na[titanic_df_drop_na['pclass'] == 2]
titanic_df_third_class = titanic_df_drop_na[titanic_df_drop_na['pclass'] == 3]
colors = plt.get_cmap('seismic')(np.linspace(0.4, 0.6, 2))
pie_labels = ['Died', 'Survived']

fig, axes = plt.subplots(1, 3, sharex=False, figsize=(12,4))
fig.suptitle('Survivor Percentage')

axes[0].pie(
    titanic_df_first_class['survived'].value_counts(),
    autopct='%1.1f%%',
    pctdistance=0.6,
    labels = pie_labels,
    colors=colors,
    wedgeprops={"linewidth": 1, "edgecolor": "white"},
    shadow=True,
)
axes[0].set_title('First Class')

axes[1].pie(
    titanic_df_second_class['survived'].value_counts(),
    autopct='%1.1f%%',
    pctdistance=0.6,
    labels = pie_labels,
    colors=colors,
    wedgeprops={"linewidth": 1, "edgecolor": "white"},
    shadow=True,
)
axes[1].set_title('Second Class')

axes[2].pie(
    titanic_df_third_class['survived'].value_counts(),
    autopct='%1.1f%%',
    pctdistance=0.6,
    labels = pie_labels,
    colors=colors,
    wedgeprops={"linewidth": 1, "edgecolor": "white"},
    shadow=True,
)
axes[2].set_title('Third Class')

plt.savefig('../assets/Titanic_Dataset_Exploration_06.webp', bbox_inches='tight')
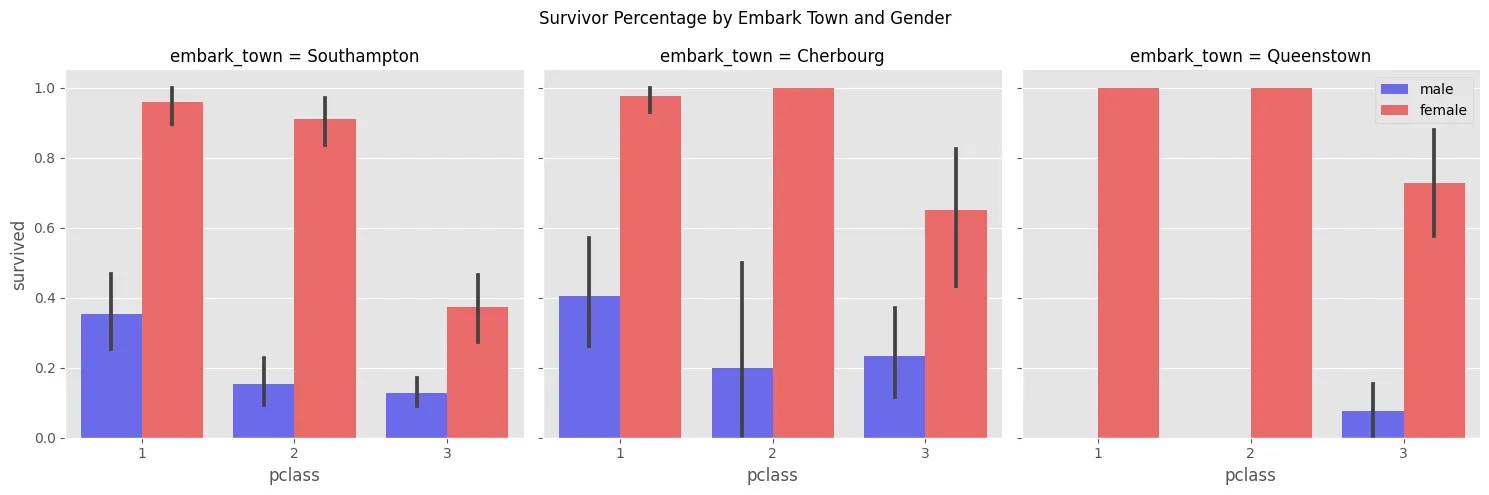
sns.catplot(
    data=titanic_df,
    x='pclass',
    y='survived',
    kind='bar',
    col='embark_town',
    orient='v',
    hue='sex',
    palette='seismic',
    legend=False
)

plt.suptitle('Survivor Percentage by Embark Town and Gender')
plt.tight_layout()
plt.legend(loc='upper right')
plt.savefig('../assets/Titanic_Dataset_Exploration_07.webp', bbox_inches='tight')
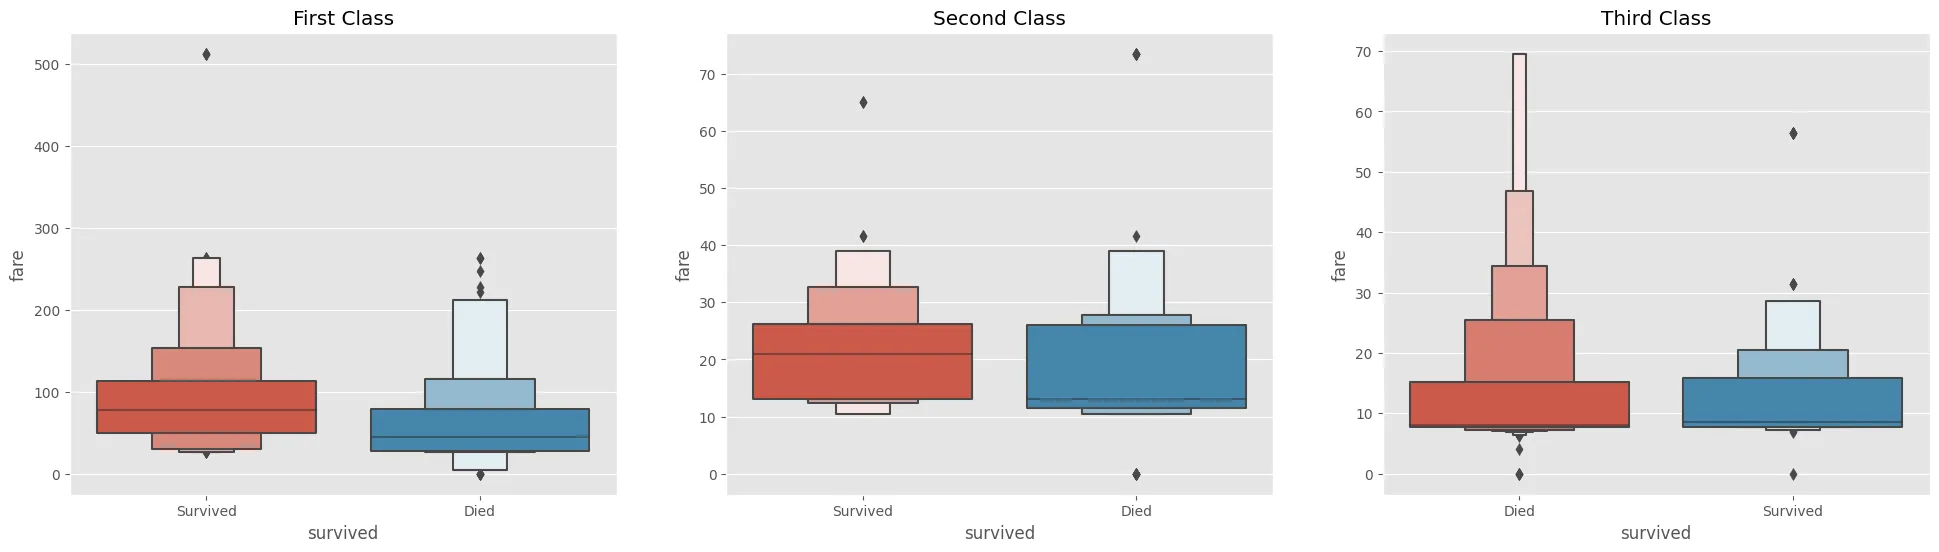
fig, axes = plt.subplots(1, 3, sharex=False, figsize=(24,6))
# fig.suptitle('Super Title')

sns.boxenplot(
    data=titanic_df_first_class,
    x='survived',
    y='fare',
    orient='v',
    ax=axes[0]
)
axes[0].set_title('First Class')

sns.boxenplot(
    data=titanic_df_second_class,
    x='survived',
    y='fare',
    orient='v',
    ax=axes[1]
)
axes[1].set_title('Second Class')

sns.boxenplot(
    data=titanic_df_third_class,
    x='survived',
    y='fare',
    orient='v',
    ax=axes[2]
)
axes[2].set_title('Third Class')

plt.savefig('../assets/Titanic_Dataset_Exploration_08.webp', bbox_inches='tight')
Passengers by Gender
titanic_df_drop_na['sex'].value_counts()
| male | 577 |
| female | 312 |
| Name: sex, dtype: int64 |
titanic_df_drop_na.groupby(['sex', 'survived'])['survived'].count()
| sex | survived | count |
|---|---|---|
| female | 0 | 81 |
| 1 | 231 | |
| male | 0 | 468 |
| 1 | 109 | |
| Name: survived, dtype: int64 |
sns.countplot(
    data=titanic_df_drop_na,
    x='sex',
    hue='class',
    palette='seismic',
    saturation=0.45,
)

plt.title('Titanic Passenger Count by Gender and Class')
plt.xlabel('Gender')
plt.ylabel('Count')

plt.savefig('../assets/Titanic_Dataset_Exploration_09.webp', bbox_inches='tight')

sns.countplot(
    data=titanic_df_drop_na,
    x='sex',
    hue='alive',
    palette='seismic',
    saturation=0.65,
)

plt.title('Titanic Passenger Count by Gender and Survival')
plt.xlabel('Gender')
plt.ylabel('Count')

plt.savefig('../assets/Titanic_Dataset_Exploration_10.webp', bbox_inches='tight')

# break down dataframe by gender
titanic_df_male = titanic_df_drop_na[titanic_df_drop_na['sex'] == 'male']
titanic_df_female = titanic_df_drop_na[titanic_df_drop_na['sex'] == 'female']
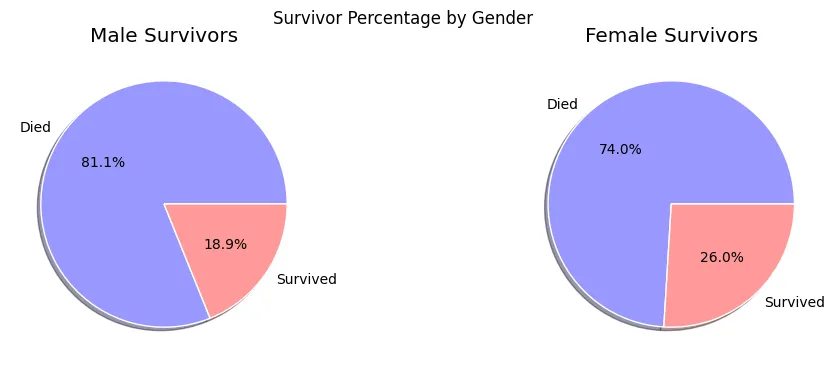
colors = plt.get_cmap('seismic')(np.linspace(0.4, 0.6, 2))
pie_labels = ['Died', 'Survived']

fig, axes = plt.subplots(1, 2, sharex=False, figsize=(12,4))
fig.suptitle('Survivor Percentage by Gender')

axes[0].pie(
    titanic_df_male['survived'].value_counts(),
    autopct='%1.1f%%',
    pctdistance=0.6,
    labels = pie_labels,
    colors=colors,
    wedgeprops={"linewidth": 1, "edgecolor": "white"},
    shadow=True,
)
axes[0].set_title('Male')

axes[1].pie(
    titanic_df_female['survived'].value_counts(),
    autopct='%1.1f%%',
    pctdistance=0.6,
    labels = pie_labels,
    colors=colors,
    wedgeprops={"linewidth": 1, "edgecolor": "white"},
    shadow=True,
)
axes[1].set_title('Female')

plt.savefig('../assets/Titanic_Dataset_Exploration_11.webp', bbox_inches='tight')
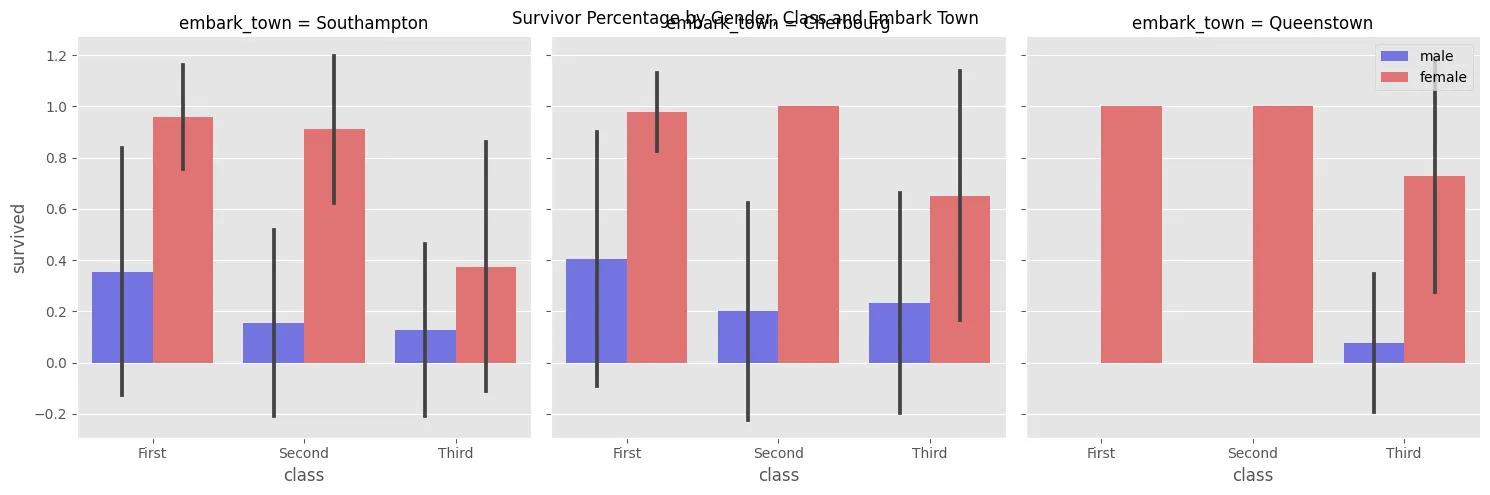
sns.catplot(
    data=titanic_df,
    x='class',
    y='survived',
    kind='bar',
    col='embark_town',
    orient='v',
    hue='sex',
    palette='seismic',
    errorbar='sd',
    legend=False,
    saturation=0.65,
)

plt.suptitle('Survivor Percentage by Gender, Class and Embark Town')
#plt.tight_layout()
plt.legend(loc='upper right')
plt.savefig('../assets/Titanic_Dataset_Exploration_12.webp', bbox_inches='tight')
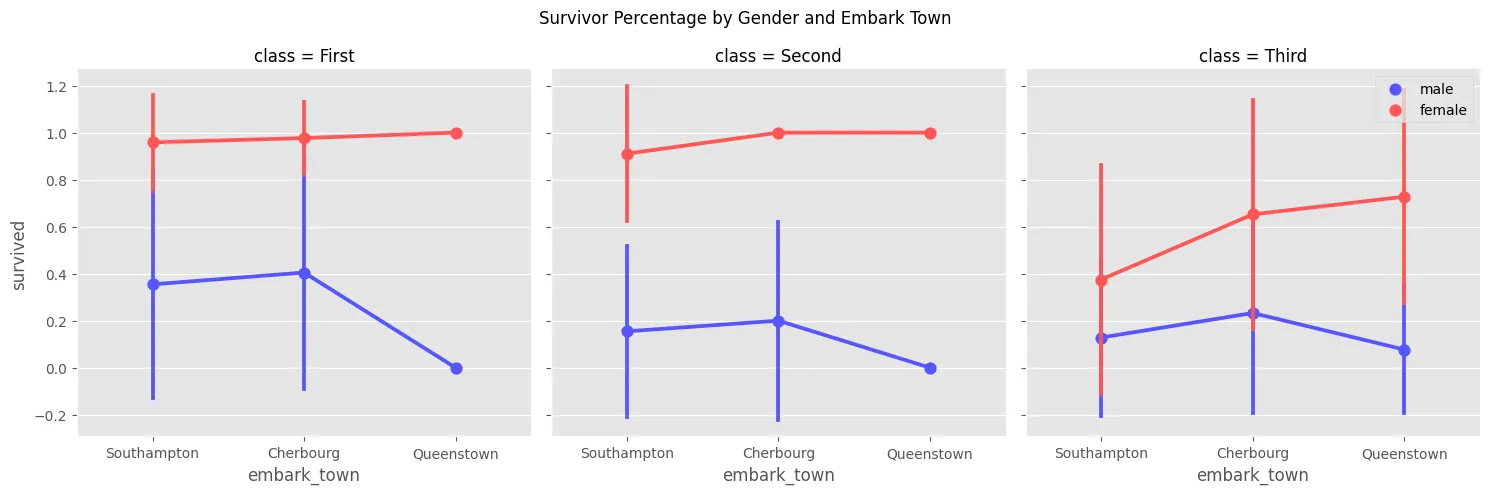
sns.catplot(
    data=titanic_df,
    x='embark_town',
    y='survived',
    kind='point',
    col='class',
    orient='v',
    hue='sex',
    palette='seismic',
    errorbar='sd',
    legend=False,
)

plt.suptitle('Survivor Percentage by Gender and Embark Town')
plt.tight_layout()
plt.legend(loc='upper right')
plt.savefig('../assets/Titanic_Dataset_Exploration_13.webp', bbox_inches='tight')
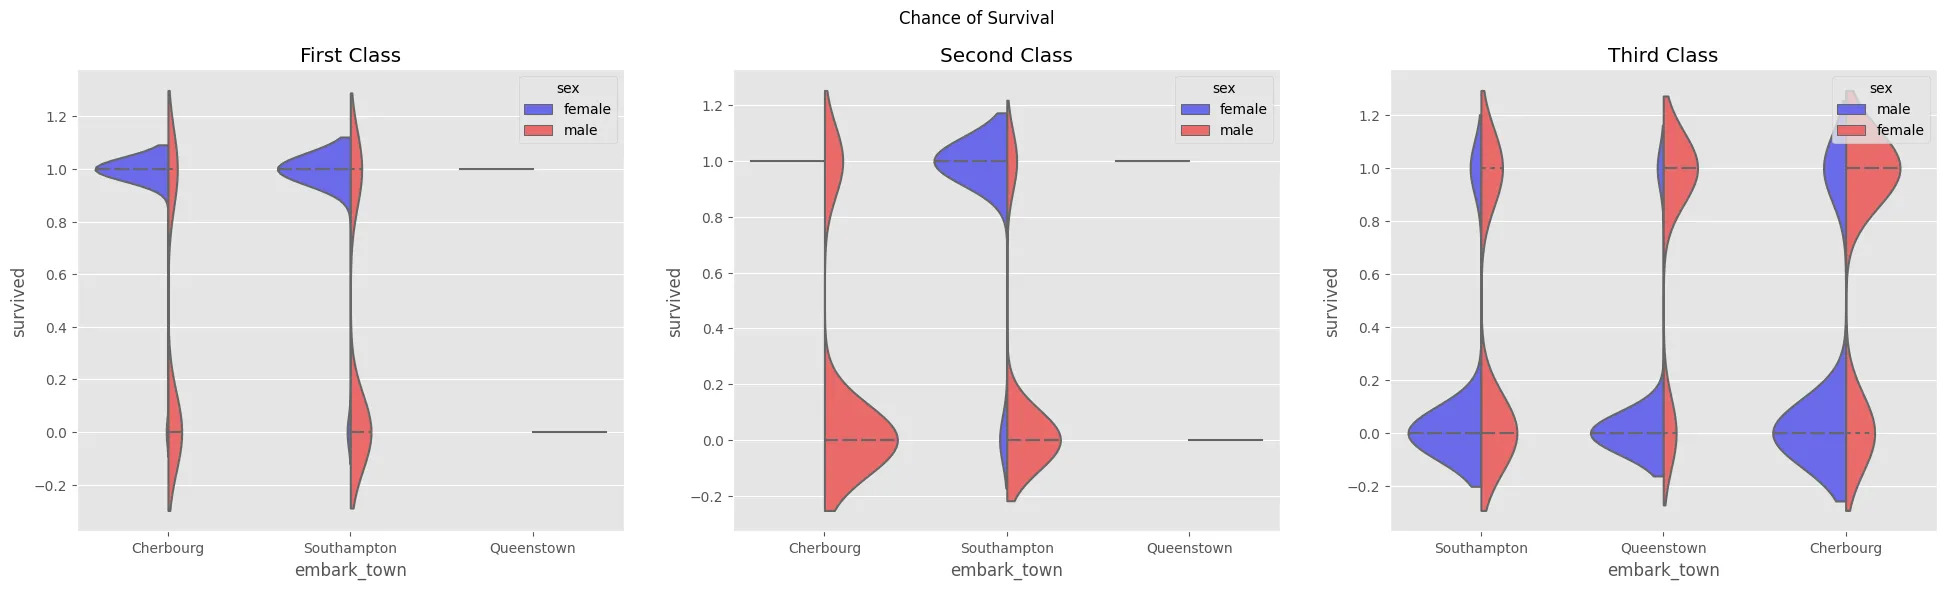
fig, axes = plt.subplots(1, 3, sharex=False, figsize=(24,6))
fig.suptitle('Chance of Survival')

sns.violinplot(
    data=titanic_df_first_class,
    x='embark_town',
    y='survived',
    orient='v',
    inner='quartile',
    bw=0.3,
    hue='sex',
    palette='seismic',
    split=True,
    ax=axes[0]
)
axes[0].set_title('First Class')

sns.violinplot(
    data=titanic_df_second_class,
    x='embark_town',
    y='survived',
    orient='v',
    inner='quartile',
    bw=0.3,
    hue='sex',
    palette='seismic',
    split=True,
    ax=axes[1]
)
axes[1].set_title('Second Class')

sns.violinplot(
    data=titanic_df_third_class,
    x='embark_town',
    y='survived',
    orient='v',
    inner='quartile',
    bw=0.3,
    hue='sex',
    palette='seismic',
    split=True,
    ax=axes[2]
)
axes[2].set_title('Third Class')

plt.savefig('../assets/Titanic_Dataset_Exploration_14.webp', bbox_inches='tight')
sns.countplot(
    data=titanic_df_drop_na,
    x='who',
    hue='survived',
    palette='seismic'
)

plt.title('Titanic Passenger Count for Families')
plt.xlabel('Family Members')
plt.ylabel('Count')

plt.savefig('../assets/Titanic_Dataset_Exploration_24.webp', bbox_inches='tight')

# break down dataframe by family members
titanic_df_man = titanic_df_drop_na[titanic_df_drop_na['who'] == 'man']
titanic_df_woman = titanic_df_drop_na[titanic_df_drop_na['who'] == 'woman']
titanic_df_child = titanic_df_drop_na[titanic_df_drop_na['who'] == 'child']
colors = plt.get_cmap('seismic')(np.linspace(0.4, 0.6, 2))
pie_labels = ['Died', 'Survived']
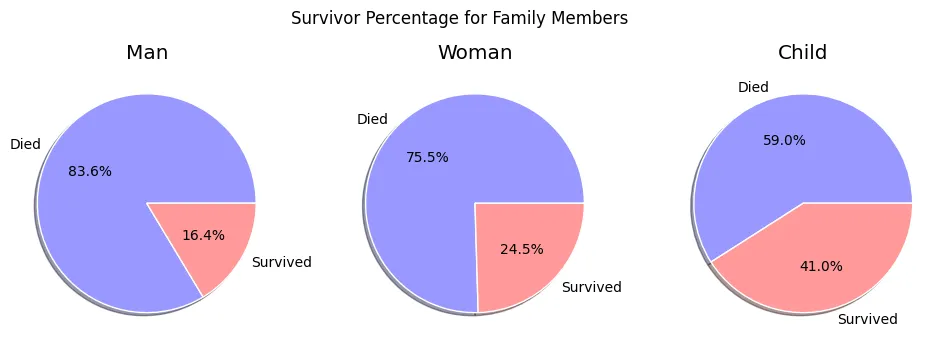
fig, axes = plt.subplots(1, 3, sharex=False, figsize=(12,4))
fig.suptitle('Survivor Percentage for Family Members')
axes[0].pie(
titanic_df_man['survived'].value_counts(),
autopct='%1.1f%%',
pctdistance=0.6,
labels = pie_labels,
colors=colors,
wedgeprops={"linewidth": 1, "edgecolor": "white"},
shadow=True,
)
axes[0].set_title('Man')
axes[1].pie(
titanic_df_woman['survived'].value_counts(),
autopct='%1.1f%%',
pctdistance=0.6,
labels = pie_labels,
colors=colors,
wedgeprops={"linewidth": 1, "edgecolor": "white"},
shadow=True,
)
axes[1].set_title('Woman')
axes[2].pie(
titanic_df_child['survived'].value_counts(),
autopct='%1.1f%%',
pctdistance=0.6,
labels = pie_labels,
colors=colors,
wedgeprops={"linewidth": 1, "edgecolor": "white"},
shadow=True,
)
axes[2].set_title('Child')
plt.savefig('../assets/Titanic_Dataset_Exploration_25.webp', bbox_inches='tight')
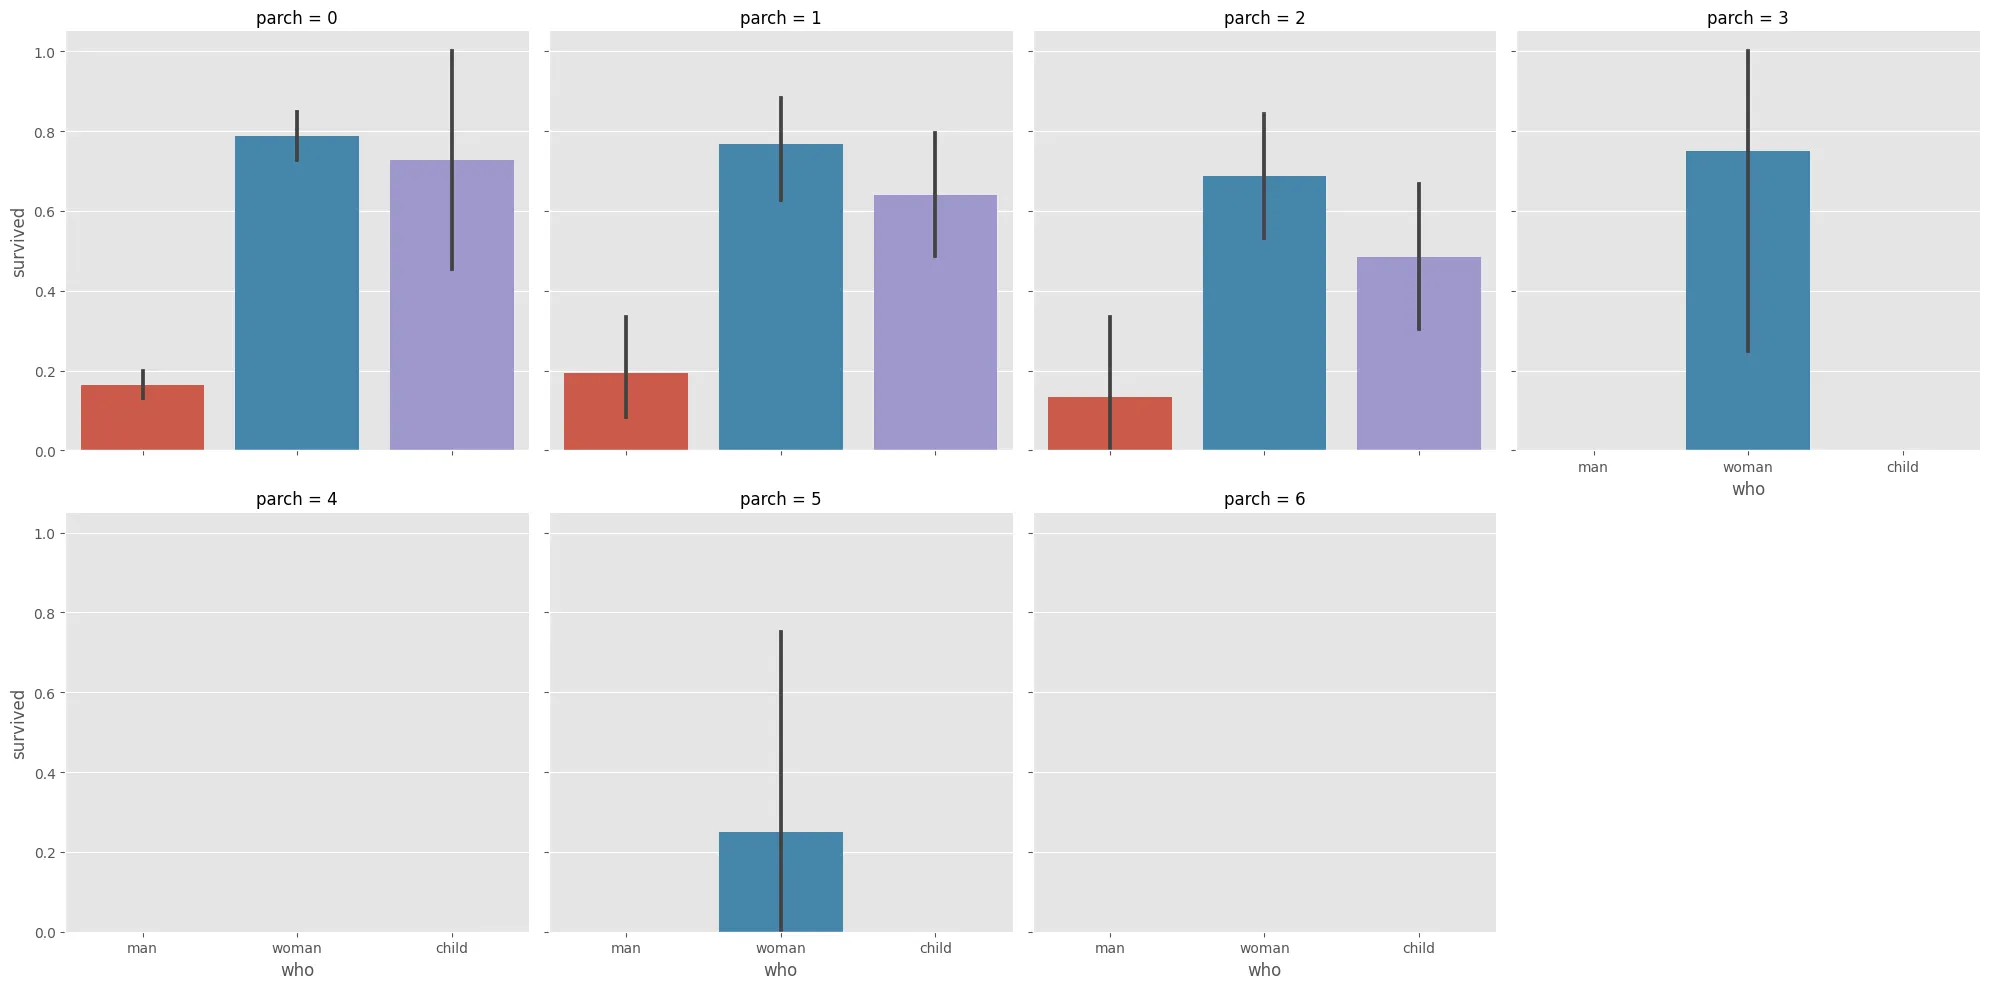
sns.catplot(
    data=titanic_df_drop_na,
    x='who',
    y='survived',
    kind='bar',
    col='parch',
    col_wrap=4
)

plt.savefig('../assets/Titanic_Dataset_Exploration_26.webp', bbox_inches='tight')
Passengers by Age
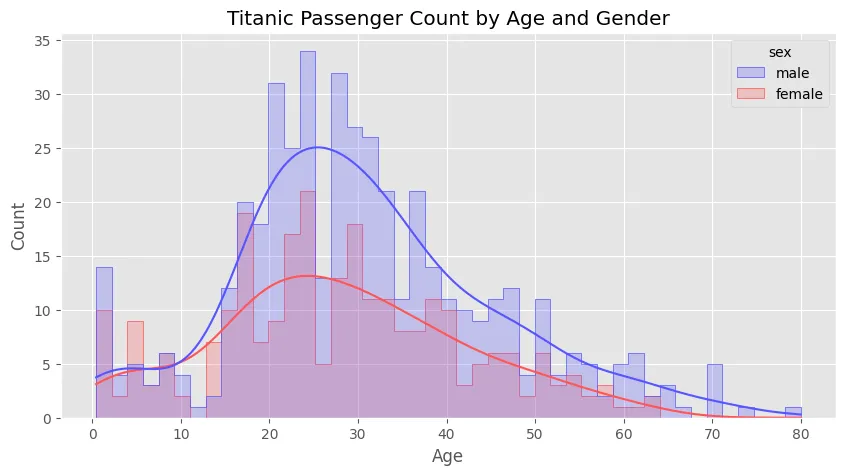
sns.histplot(
    data=titanic_df,
    x='age',
    bins=45,
    element='step',
    hue='sex',
    kde=True,
    palette='seismic'
)

plt.title('Titanic Passenger Count by Age and Gender')
plt.xlabel('Age')

plt.savefig('../assets/Titanic_Dataset_Exploration_15.webp', bbox_inches='tight')
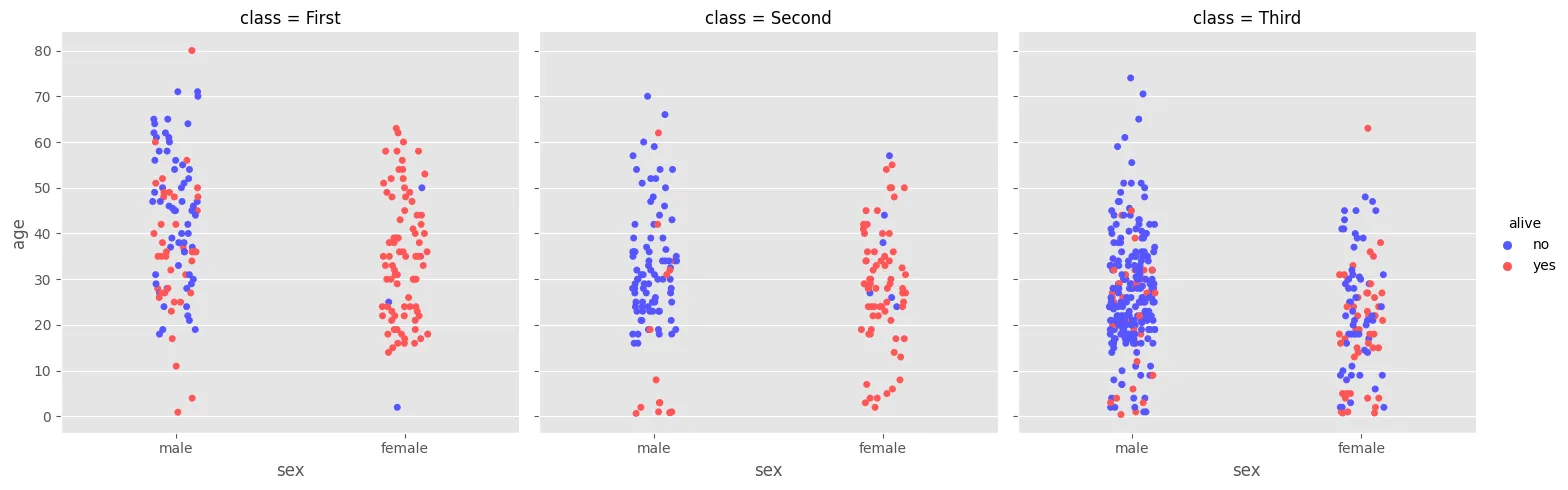
sns.catplot(
    data=titanic_df,
    x='sex',
    y='age',
    hue='alive',
    palette='seismic',
    col='class',
    legend=True
)

#plt.suptitle('Titanic Passenger Distribution by Gender, Age and Class')
plt.savefig('../assets/Titanic_Dataset_Exploration_16.webp', bbox_inches='tight')
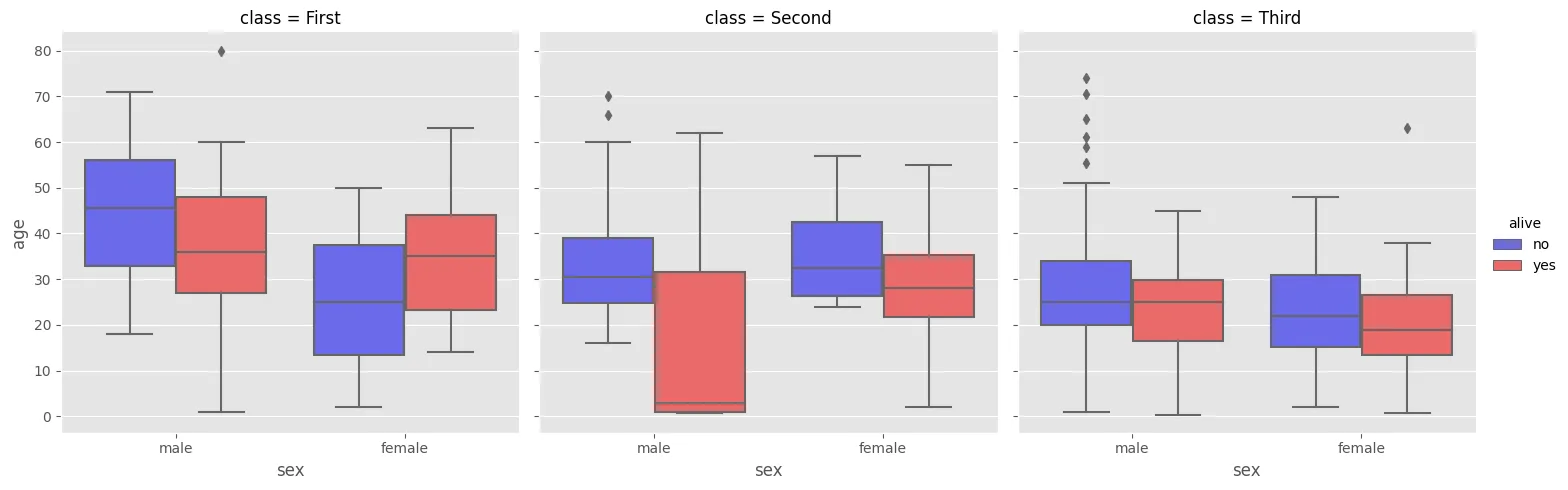
sns.catplot(
    kind='box',
    data=titanic_df,
    x='sex',
    y='age',
    hue='alive',
    palette='seismic',
    col='class',
    legend=True
)

#plt.suptitle('Titanic Passenger Distribution by Gender, Age and Class')
plt.savefig('../assets/Titanic_Dataset_Exploration_17.webp', bbox_inches='tight')
#plt.tight_layout()
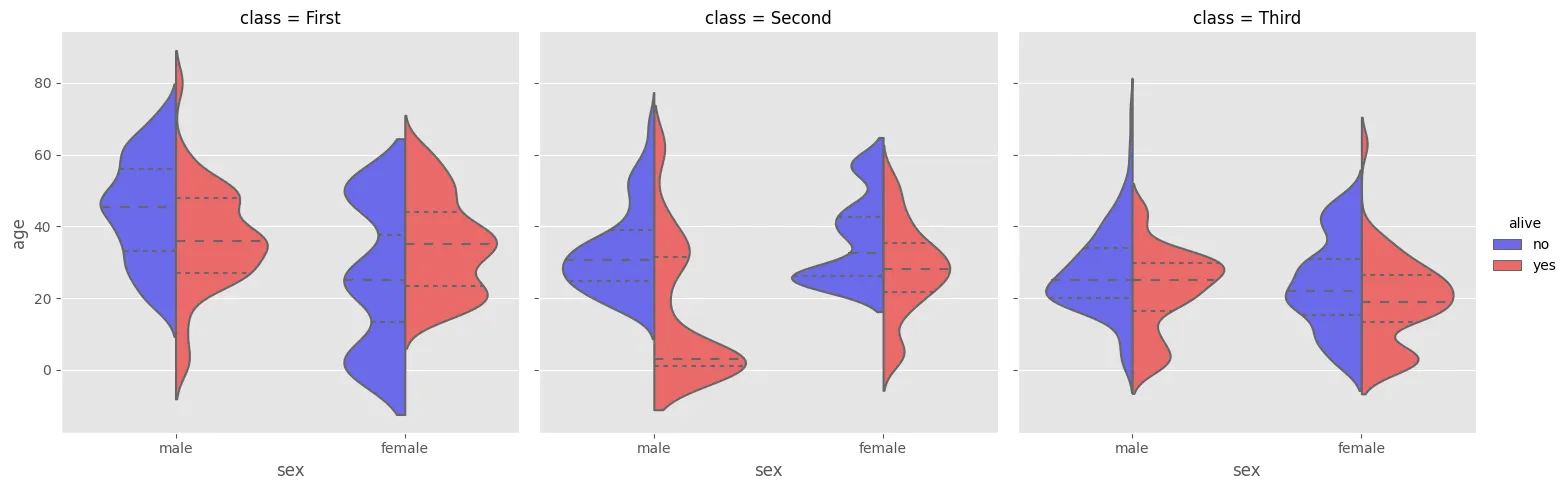
sns.catplot(
    kind='violin',
    data=titanic_df,
    x='sex',
    y='age',
    orient='v',
    inner='quartile',
    bw=0.3,
    hue='alive',
    palette='seismic',
    col='class',
    split=True,
    legend=True
)

#plt.suptitle('Titanic Passenger Distribution by Gender, Age and Class')
plt.savefig('../assets/Titanic_Dataset_Exploration_18.webp', bbox_inches='tight')
#plt.tight_layout()
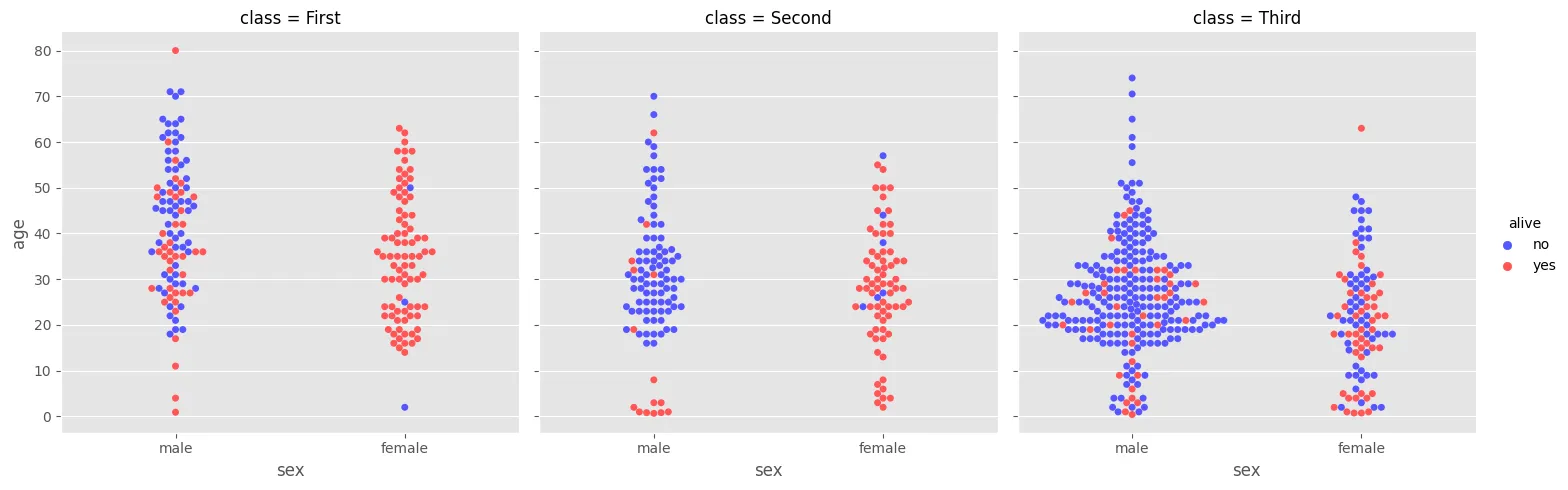
sns.catplot(
    kind='swarm',
    data=titanic_df,
    x='sex',
    y='age',
    hue='alive',
    palette='seismic',
    col='class'
)

plt.savefig('../assets/Titanic_Dataset_Exploration_19.webp', bbox_inches='tight')
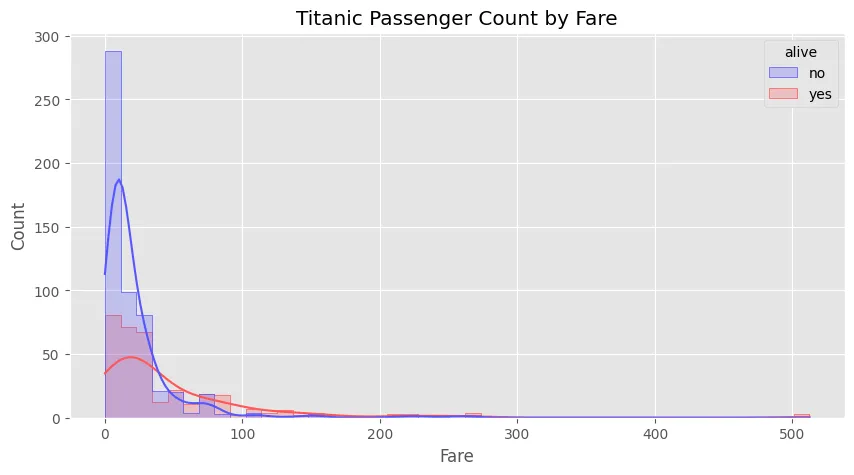
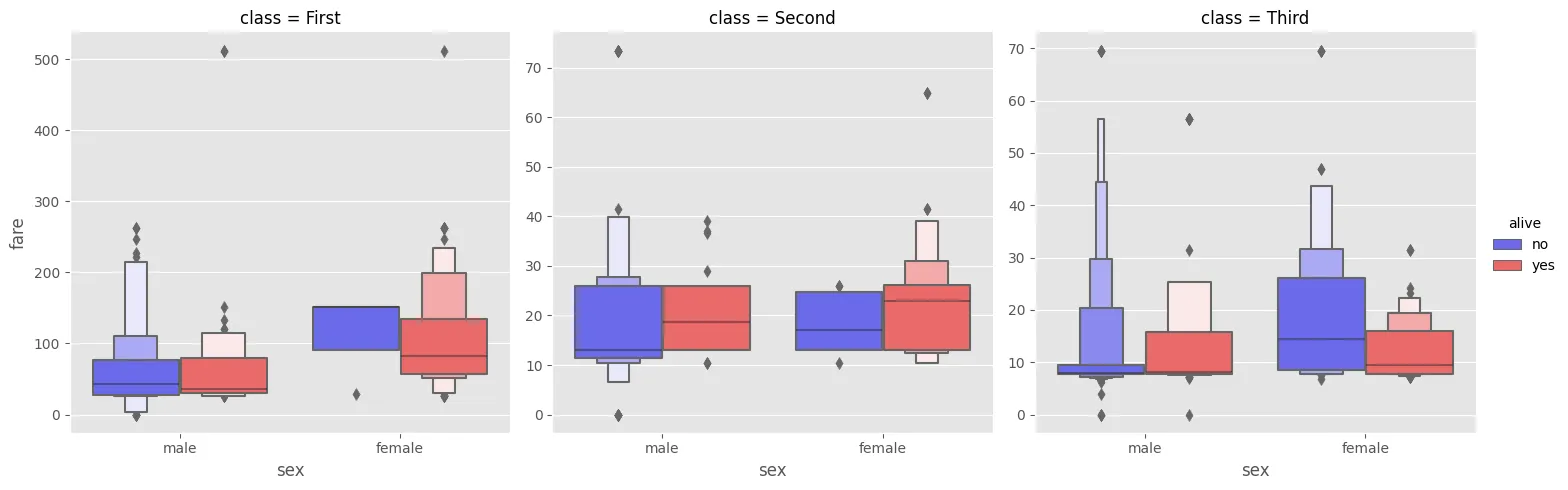
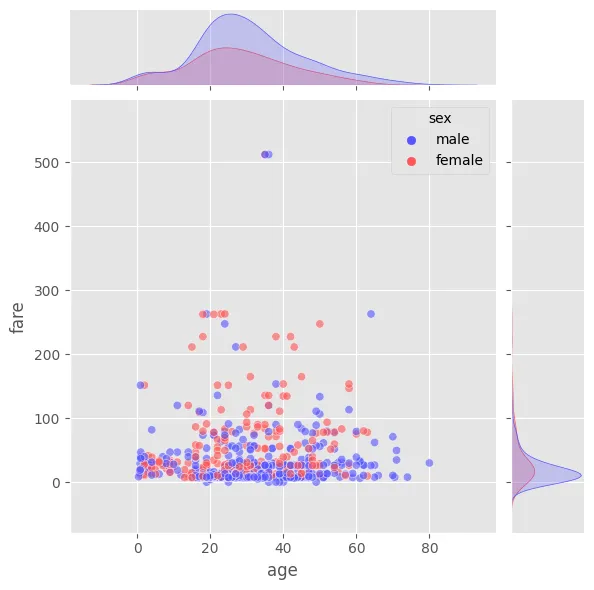
Passengers by Fare
sns.histplot(
    data=titanic_df,
    x='fare',
    bins=45,
    element='step',
    hue='alive',
    kde=True,
    palette='seismic'
)

plt.title('Titanic Passenger Count by Fare')
plt.xlabel('Fare')

plt.savefig('../assets/Titanic_Dataset_Exploration_20.webp', bbox_inches='tight')
sns.catplot(
    kind='boxen',
    data=titanic_df,
    x='sex',
    y='fare',
    hue='alive',
    palette='seismic',
    col='class',
    sharey=False,
    legend=True
)

plt.savefig('../assets/Titanic_Dataset_Exploration_21.webp', bbox_inches='tight')
sns.jointplot(
    data=titanic_df,
    x='age',
    y='fare',
    kind='scatter',
    hue='sex',
    palette='seismic',
    alpha=0.6
)

plt.savefig('../assets/Titanic_Dataset_Exploration_22.webp', bbox_inches='tight')
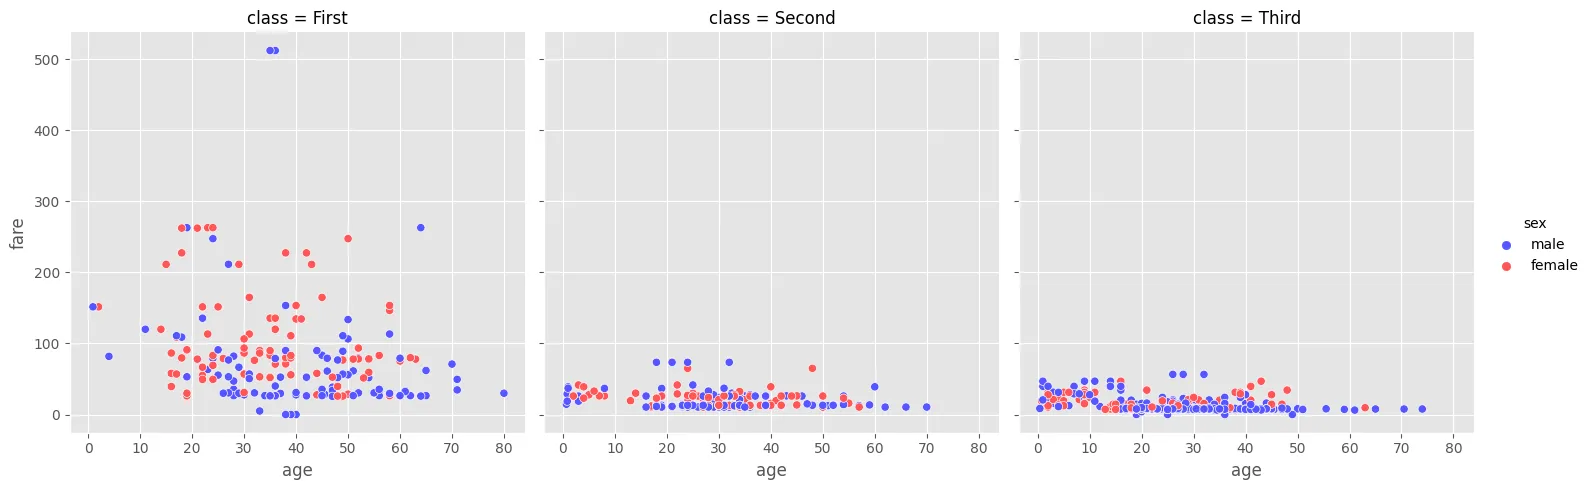
sns.relplot(
    data=titanic_df,
    x='age',
    y='fare',
    hue='sex',
    palette='seismic',
    col='class'
)

plt.savefig('../assets/Titanic_Dataset_Exploration_23.webp', bbox_inches='tight')