Whose ratings should you trust?
Dataset
!wget https://raw.githubusercontent.com/fivethirtyeight/data/master/fandango/fandango_score_comparison.csv -P dataset
!wget https://raw.githubusercontent.com/fivethirtyeight/data/master/fandango/fandango_scrape.csv -P dataset
fandango_score_comparison.csv contains every film that has a Rotten Tomatoes rating, a RT User rating, a Metacritic score, a Metacritic User score, and IMDb score, and at least 30 fan reviews on Fandango. The data from Fandango was pulled on Aug. 24, 2015:
| Column | Definition |
|---|---|
| FILM | The film in question |
| RottenTomatoes | The Rotten Tomatoes Tomatometer score for the film |
| RottenTomatoes_User | The Rotten Tomatoes user score for the film |
| Metacritic | The Metacritic critic score for the film |
| Metacritic_User | The Metacritic user score for the film |
| IMDB | The IMDb user score for the film |
| Fandango_Stars | The number of stars the film had on its Fandango movie page |
| Fandango_Ratingvalue | The Fandango ratingValue for the film, as pulled from the HTML of each page. This is the actual average score the movie obtained. |
| RT_norm | The Rotten Tomatoes Tomatometer score for the film , normalized to a 0 to 5 point system |
| RT_user_norm | The Rotten Tomatoes user score for the film , normalized to a 0 to 5 point system |
| Metacritic_norm | The Metacritic critic score for the film, normalized to a 0 to 5 point system |
| Metacritic_user_nom | The Metacritic user score for the film, normalized to a 0 to 5 point system |
| IMDB_norm | The IMDb user score for the film, normalized to a 0 to 5 point system |
| RT_norm_round | The Rotten Tomatoes Tomatometer score for the film , normalized to a 0 to 5 point system and rounded to the nearest half-star |
| RT_user_norm_round | The Rotten Tomatoes user score for the film , normalized to a 0 to 5 point system and rounded to the nearest half-star |
| Metacritic_norm_round | The Metacritic critic score for the film, normalized to a 0 to 5 point system and rounded to the nearest half-star |
| Metacritic_user_norm_round | The Metacritic user score for the film, normalized to a 0 to 5 point system and rounded to the nearest half-star |
| IMDB_norm_round | The IMDb user score for the film, normalized to a 0 to 5 point system and rounded to the nearest half-star |
| Metacritic_user_vote_count | The number of user votes the film had on Metacritic |
| IMDB_user_vote_count | The number of user votes the film had on IMDb |
| Fandango_votes | The number of user votes the film had on Fandango |
| Fandango_Difference | The difference between the presented Fandango_Stars and the actual Fandango_Ratingvalue |
fandango_scrape.csv contains every film we pulled from Fandango:
| Column | Definiton |
|---|---|
| FILM | The movie |
| STARS | Number of stars presented on Fandango.com |
| RATING | The Fandango ratingValue for the film, as pulled from the HTML of each page. This is the actual average score the movie obtained. |
| VOTES | number of people who had reviewed the film at the time we pulled it. |
import numpy as np
import matplotlib.pyplot as plt
import pandas as pd
import seaborn as sns
Exploration
Fandango Displayed Star Scores vs User Ratings
fandango_df = pd.read_csv('dataset/fandango_scrape.csv')
fandango_df.head(5)
| FILM | STARS | RATING | VOTES | |
|---|---|---|---|---|
| 0 | Fifty Shades of Grey (2015) | 4.0 | 3.9 | 34846 |
| 1 | Jurassic World (2015) | 4.5 | 4.5 | 34390 |
| 2 | American Sniper (2015) | 5.0 | 4.8 | 34085 |
| 3 | Furious 7 (2015) | 5.0 | 4.8 | 33538 |
| 4 | Inside Out (2015) | 4.5 | 4.5 | 15749 |
fandango_df.info()
<class 'pandas.core.frame.DataFrame'>
- RangeIndex: 510 entries, 0 to 509
- Data columns (total 4 columns):
| # | Column | Non-Null Count | Dtype |
|---|---|---|---|
| 0 | FILM | 510 non-null | object |
| 1 | STARS | 510 non-null | float64 |
| 2 | RATING | 510 non-null | float64 |
| 3 | VOTES | 510 non-null | int64 |
| dtypes: float64(2), int64(1), object(1) | |||
| memory usage: 16.1+ KB |
fandango_df.describe()
| STARS | RATING | VOTES | |
|---|---|---|---|
| count | 510.000000 | 510.000000 | 510.000000 |
| mean | 3.532353 | 3.351765 | 1134.364706 |
| std | 1.585616 | 1.512628 | 3809.952176 |
| min | 0.000000 | 0.000000 | 0.000000 |
| 25% | 3.500000 | 3.025000 | 2.000000 |
| 50% | 4.000000 | 3.800000 | 17.500000 |
| 75% | 4.500000 | 4.300000 | 183.500000 |
| max | 5.000000 | 5.000000 | 34846.000000 |
sns.set(
    style='darkgrid',
    palette='winter'
)
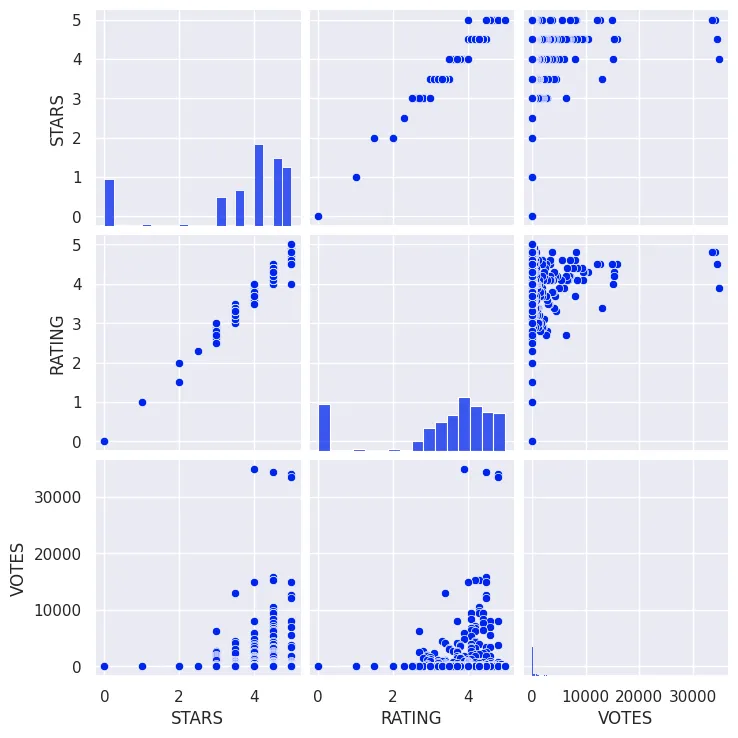
# Find Correlations between Stars, Ratings and Number of Votes
sns.pairplot(
    data=fandango_df
)

plt.savefig('assets/FiveThirtyEight_Fandango_Dataset_01.webp', bbox_inches='tight')
# how do the columns correlate
fandango_df.corr(numeric_only=True)
# there is a small difference between stars and user ratings
| STARS | RATING | VOTES | |
|---|---|---|---|
| STARS | 1.000000 | 0.994870 | 0.165774 |
| RATING | 0.994870 | 1.000000 | 0.165147 |
| VOTES | 0.165774 | 0.165147 | 1.000000 |
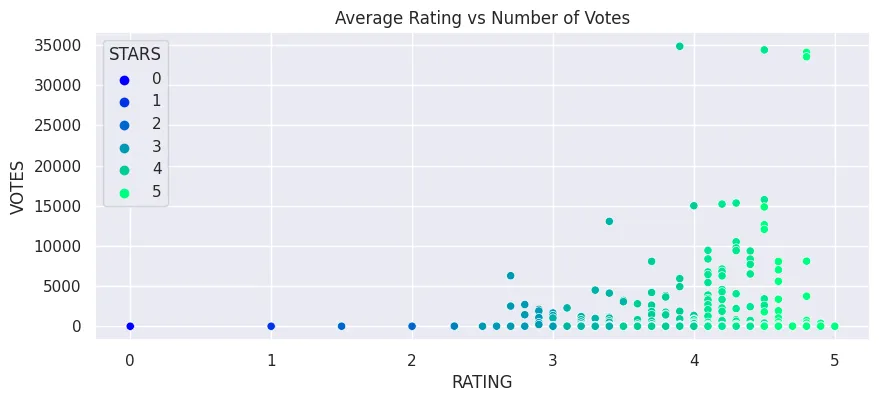
plt.figure(figsize=(10, 4))

sns.scatterplot(
    data=fandango_df,
    x='RATING',
    y='VOTES',
    hue='STARS',
    palette='winter',
    # size='training level'
).set_title('Average Rating vs Number of Votes')

plt.savefig('assets/FiveThirtyEight_Fandango_Dataset_02.webp', bbox_inches='tight')
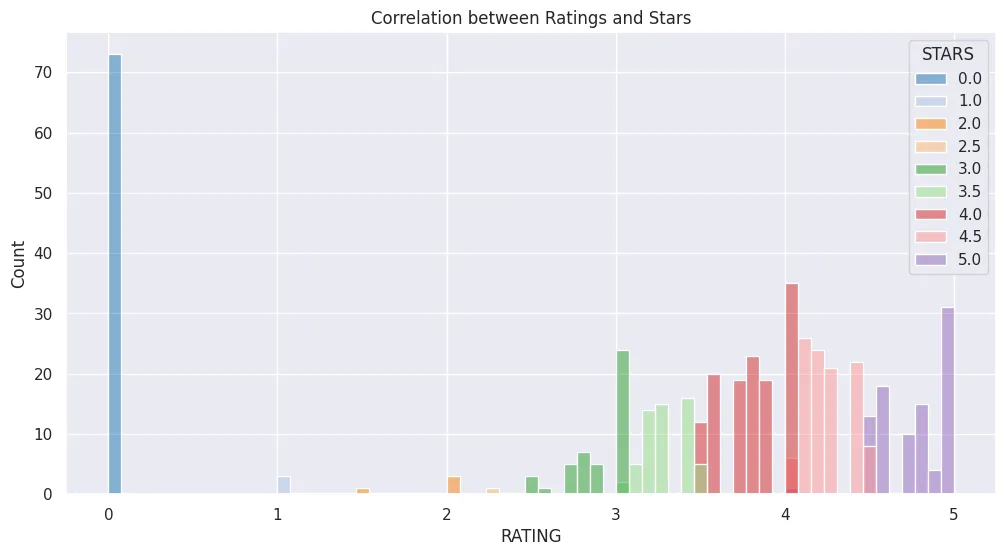
plt.figure(figsize=(12, 6))
plt.title('Correlation between Ratings and Stars')

sns.histplot(
    data=fandango_df,
    x='RATING',
    bins=65,
    hue='STARS',
    palette='tab20',
    kde=False
)

plt.savefig('assets/FiveThirtyEight_Fandango_Dataset_03.webp', bbox_inches='tight')
# add YEAR column
fandango_df['YEAR'] = fandango_df['FILM'].apply(
    lambda x: x.replace('"','')
).apply(
    lambda x: x.replace('(1)', '(0000)')
).apply(
    lambda x: x[-5:-1]
)

fandango_df['YEAR'].tail(5)
| 505 | 2015 |
| 506 | 2015 |
| 507 | 2015 |
| 508 | 1964 |
| 509 | 0000 |
| Name: YEAR, dtype: object |
fandango_df['YEAR'].value_counts()
| 2015 | 478 |
| 2014 | 23 |
| 0000 | 7 |
| 2016 | 1 |
| 1964 | 1 |
| Name: YEAR, dtype: int64 |
plt.figure(figsize=(10, 5))
plt.title('Number of Movies by Year')

sns.countplot(
    data=fandango_df,
    x='YEAR',
    hue='STARS',
    palette='winter'
)

plt.savefig('assets/FiveThirtyEight_Fandango_Dataset_04.webp', bbox_inches='tight')

fandango_years_df = fandango_df.groupby(['YEAR'])
temp_df = fandango_years_df.mean(numeric_only=True).round(1).reset_index()
temp_df.head(5)
| YEAR | STARS | RATING | VOTES | |
|---|---|---|---|---|
| 0 | 0000 | 1.1 | 1.1 | 0.4 |
| 1 | 1964 | 0.0 | 0.0 | 0.0 |
| 2 | 2014 | 4.1 | 3.8 | 3341.4 |
| 3 | 2015 | 3.5 | 3.4 | 1049.5 |
| 4 | 2016 | 5.0 | 4.7 | 11.0 |
plt.figure(figsize=(10, 4))
plt.title('Average Rating by Year')

plot = sns.barplot(x='RATING', y='STARS' , data=temp_df, palette='winter', hue='YEAR' )

plt.legend(bbox_to_anchor=(1.01,1.01))
plt.savefig('assets/FiveThirtyEight_Fandango_Dataset_05.webp', bbox_inches='tight')

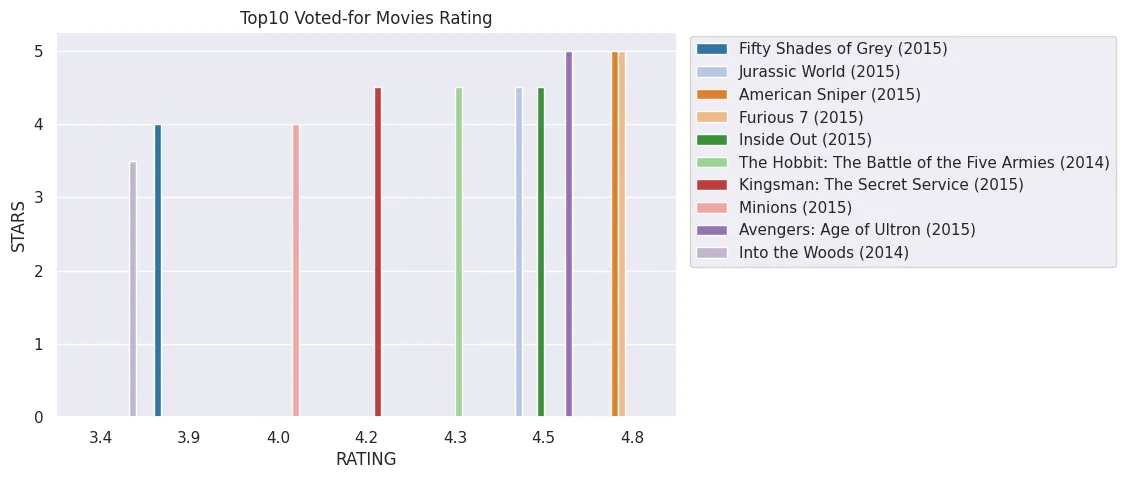
# movies with highest voter count
plt.figure(figsize=(8, 5))
plt.title('Top10 Voted-for Movies Rating')

plot = sns.barplot(
    x='RATING',
    y='STARS',
    data=fandango_df.sort_values(by='VOTES', ascending=False).head(10),
    palette='tab20', hue='FILM' )

plt.legend(bbox_to_anchor=(1.01,1.01))

plt.savefig('assets/FiveThirtyEight_Fandango_Dataset_06.webp', bbox_inches='tight')
# how many movies have zero votes
fandango_df[fandango_df['VOTES'] == 0]['FILM'].count()
# 73
# remove all 73 movies nobody voted for
fandango_df_non_zero_votes = fandango_df[fandango_df['VOTES'] != 0]
fandango_df_non_zero_votes.sort_values(by='VOTES', ascending=True).head(5)
| FILM | STARS | RATING | VOTES | YEAR | |
|---|---|---|---|---|---|
| 436 | Z For Zachariah (2015) | 5.0 | 5.0 | 1 | 2015 |
| 415 | Buggs Bunny (2015) | 4.0 | 4.0 | 1 | 2015 |
| 414 | Wild Canaries (2015) | 3.0 | 3.0 | 1 | 2015 |
| 413 | The Living (2015) | 3.0 | 3.0 | 1 | 2015 |
| 412 | The Face of an Angel (2015) | 3.0 | 3.0 | 1 | 2015 |
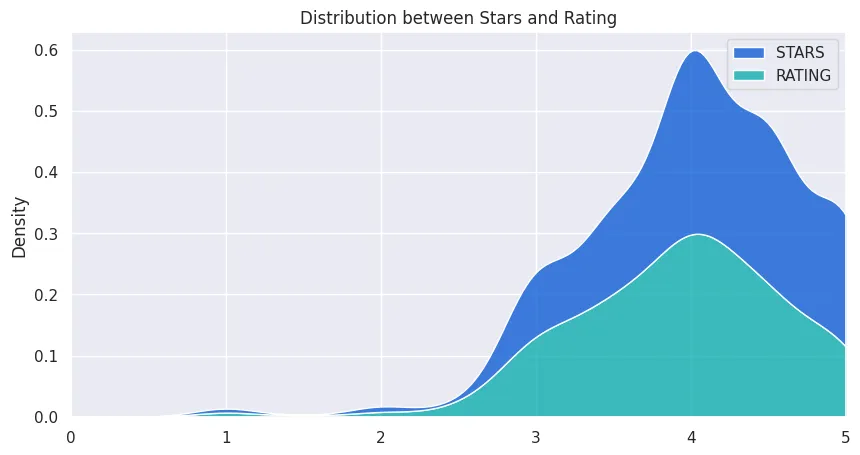
# do ratings and star follow the same distribution?
plt.figure(figsize=(10, 5))
plt.title('Distribution between Stars and Rating')

fandango_df_no_votes = fandango_df_non_zero_votes[['STARS','RATING']]

plot = sns.kdeplot(data=fandango_df_no_votes, multiple="stack", palette='winter')

plot.set_xlim(0,5)

plt.savefig('assets/FiveThirtyEight_Fandango_Dataset_07.webp', bbox_inches='tight')
# quantify discrepancy between rating and star rating
fandango_df_no_votes['RATE_STAR_DIFF'] = (
    fandango_df_no_votes['STARS'] - fandango_df_no_votes['RATING']
).round(1)

fandango_df_no_votes[['RATING', 'STARS', 'RATE_STAR_DIFF']].head(10)
| RATING | STARS | RATE_STAR_DIFF | |
|---|---|---|---|
| 0 | 3.9 | 4.0 | 0.1 |
| 1 | 4.5 | 4.5 | 0.0 |
| 2 | 4.8 | 5.0 | 0.2 |
| 3 | 4.8 | 5.0 | 0.2 |
| 4 | 4.5 | 4.5 | 0.0 |
| 5 | 4.3 | 4.5 | 0.2 |
| 6 | 4.2 | 4.5 | 0.3 |
| 7 | 4.0 | 4.0 | 0.0 |
| 8 | 4.5 | 5.0 | 0.5 |
| 9 | 3.4 | 3.5 | 0.1 |
# what movie has the greatest deviation
fandango_df_no_votes.sort_values(by='RATE_STAR_DIFF', ascending=False).head(10)
| STARS | RATING | RATE_STAR_DIFF | |
|---|---|---|---|
| 381 | 5.0 | 4.0 | 1.0 |
| 190 | 5.0 | 4.5 | 0.5 |
| 161 | 4.0 | 3.5 | 0.5 |
| 210 | 4.5 | 4.0 | 0.5 |
| 209 | 4.0 | 3.5 | 0.5 |
| 200 | 5.0 | 4.5 | 0.5 |
| 189 | 4.5 | 4.0 | 0.5 |
| 169 | 5.0 | 4.5 | 0.5 |
| 122 | 4.0 | 3.5 | 0.5 |
| 50 | 4.0 | 3.5 | 0.5 |
# what is the title of movie `381`
fandango_df.iloc[381]
| FILM | Turbo Kid (2015) |
| STARS | 5.0 |
| RATING | 4.0 |
| VOTES | 2 |
| YEAR | 2015 |
| Name: 381, dtype: object |
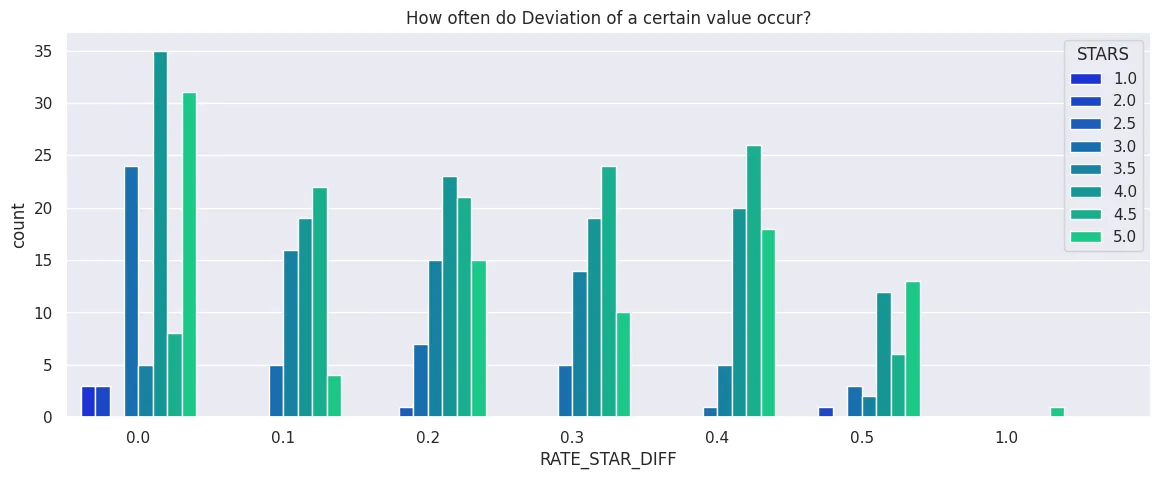
plt.figure(figsize=(14, 5))
plt.title('How often do Deviation of a certain value occur?')

plot = sns.countplot(
    data=fandango_df_no_votes,
    x='RATE_STAR_DIFF',
    hue='STARS',
    palette='winter'
)

plot.set_xticks(np.arange(8))

plt.savefig('assets/FiveThirtyEight_Fandango_Dataset_08.webp', bbox_inches='tight')
# there are only positive deviations
# and the sum of movies with positive
# deviations is greater than the number
# of movies with a deviation of zero
Comparing Fandango Star Ratings to other Sites
all_sites_df = pd.read_csv('dataset/fandango_score_comparison.csv')
all_sites_df.head(2).transpose()
| 0 | 1 | |
|---|---|---|
| FILM | Avengers: Age of Ultron (2015) | Cinderella (2015) |
| RottenTomatoes | 74 | 85 |
| RottenTomatoes_User | 86 | 80 |
| Metacritic | 66 | 67 |
| Metacritic_User | 7.1 | 7.5 |
| IMDB | 7.8 | 7.1 |
| Fandango_Stars | 5.0 | 5.0 |
| Fandango_Ratingvalue | 4.5 | 4.5 |
| RT_norm | 3.7 | 4.25 |
| RT_user_norm | 4.3 | 4.0 |
| Metacritic_norm | 3.3 | 3.35 |
| Metacritic_user_nom | 3.55 | 3.75 |
| IMDB_norm | 3.9 | 3.55 |
| RT_norm_round | 3.5 | 4.5 |
| RT_user_norm_round | 4.5 | 4.0 |
| Metacritic_norm_round | 3.5 | 3.5 |
| Metacritic_user_norm_round | 3.5 | 4.0 |
| IMDB_norm_round | 4.0 | 3.5 |
| Metacritic_user_vote_count | 1330 | 249 |
| IMDB_user_vote_count | 271107 | 65709 |
| Fandango_votes | 14846 | 12640 |
| Fandango_Difference | 0.5 | 0.5 |
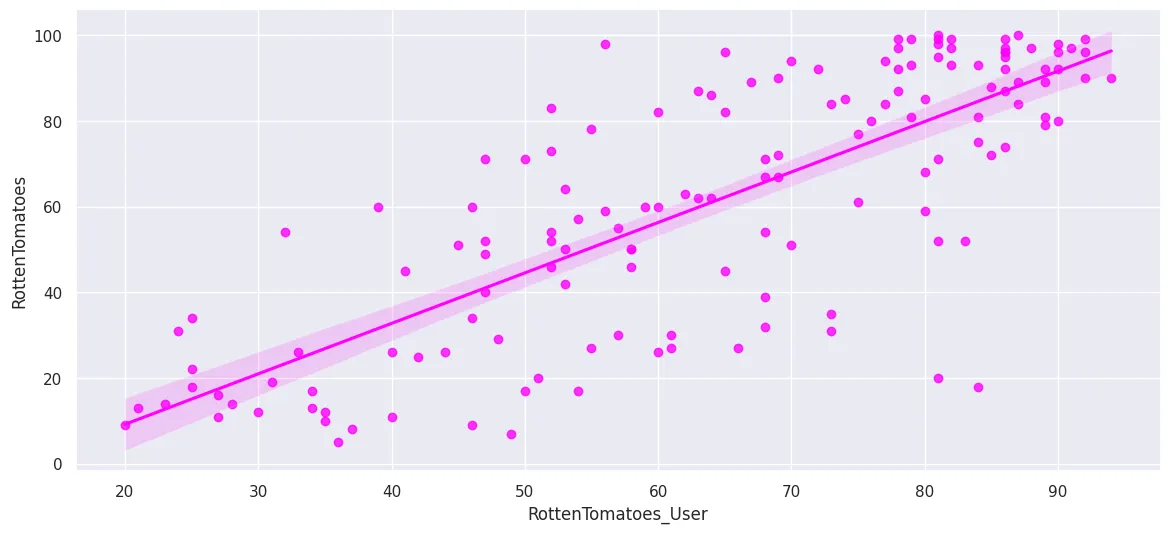
Rotten Tomatoes
plt.figure(figsize=(14, 6))

sns.regplot(
    x='RottenTomatoes_User',
    y='RottenTomatoes',
    data=all_sites_df,
    ci=95,
    n_boot=1000,
    color='fuchsia'
)

plt.savefig('assets/FiveThirtyEight_Fandango_Dataset_09a.webp', bbox_inches='tight')
plt.figure(figsize=(14, 6))
sns.scatterplot(
x='RottenTomatoes_User',
y='RottenTomatoes',
data=all_sites_df,
hue='Fandango_Stars',
palette='winter',
size='Fandango_Ratingvalue'
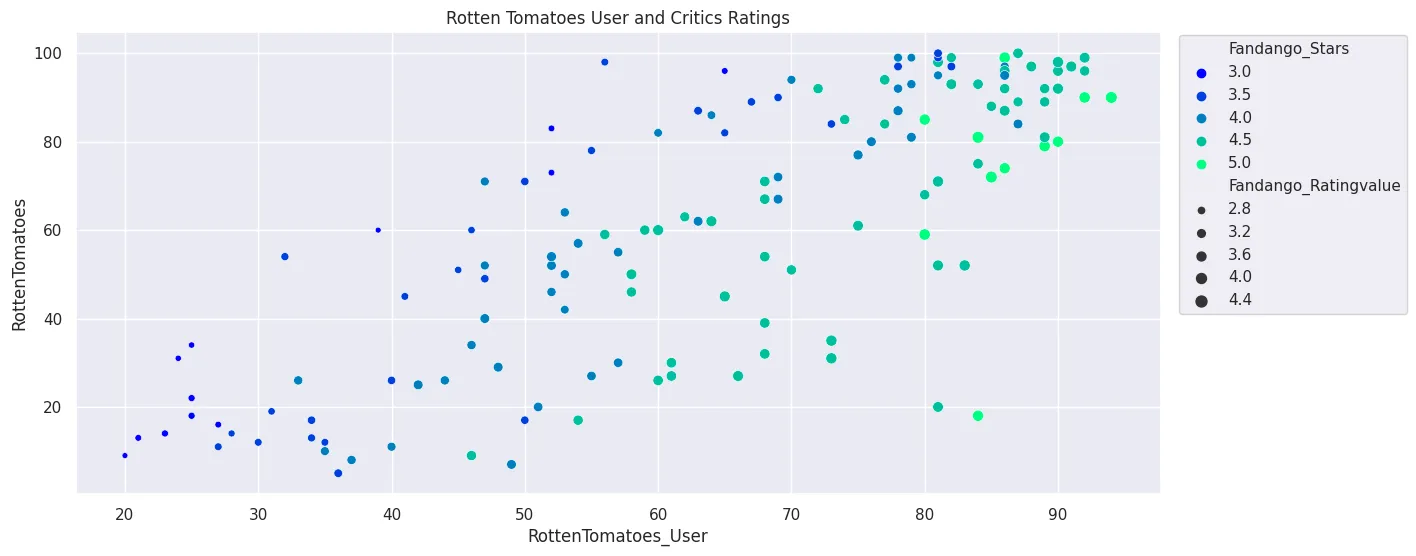
).set_title('Rotten Tomatoes User and Critics Ratings')
plt.legend(bbox_to_anchor=(1.01,1.01))
plt.savefig('assets/FiveThirtyEight_Fandango_Dataset_09b.webp', bbox_inches='tight')
# quantify discrepancy between critics and user rating
all_sites_df['RottenTomatoes_Critic_User_Diff'] = (
    all_sites_df['RottenTomatoes'] - all_sites_df['RottenTomatoes_User']
).round(1)

all_sites_df[
    ['RottenTomatoes_Critic_User_Diff', 'RottenTomatoes', 'RottenTomatoes_User']
].head(10)
| RottenTomatoes_Critic_User_Diff | RottenTomatoes | RottenTomatoes_User | |
|---|---|---|---|
| 0 | -12 | 74 | 86 |
| 1 | 5 | 85 | 80 |
| 2 | -10 | 80 | 90 |
| 3 | -66 | 18 | 84 |
| 4 | -14 | 14 | 28 |
| 5 | 1 | 63 | 62 |
| 6 | -11 | 42 | 53 |
| 7 | 22 | 86 | 64 |
| 8 | 17 | 99 | 82 |
| 9 | 2 | 89 | 87 |
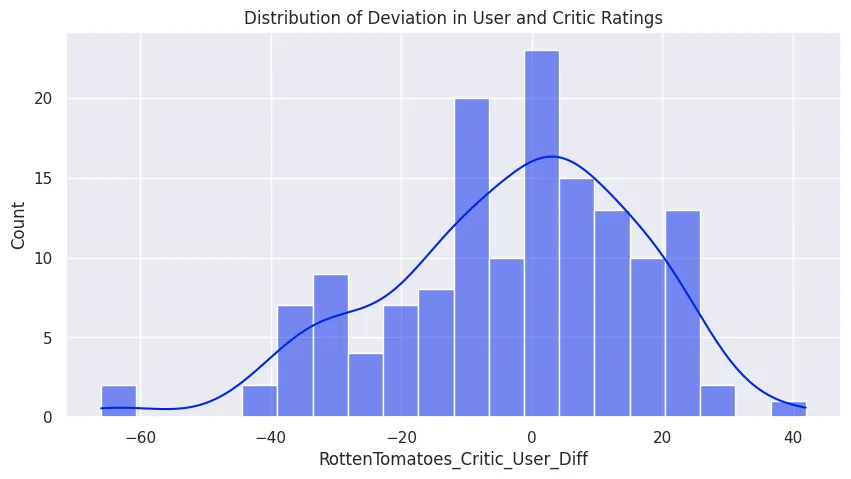
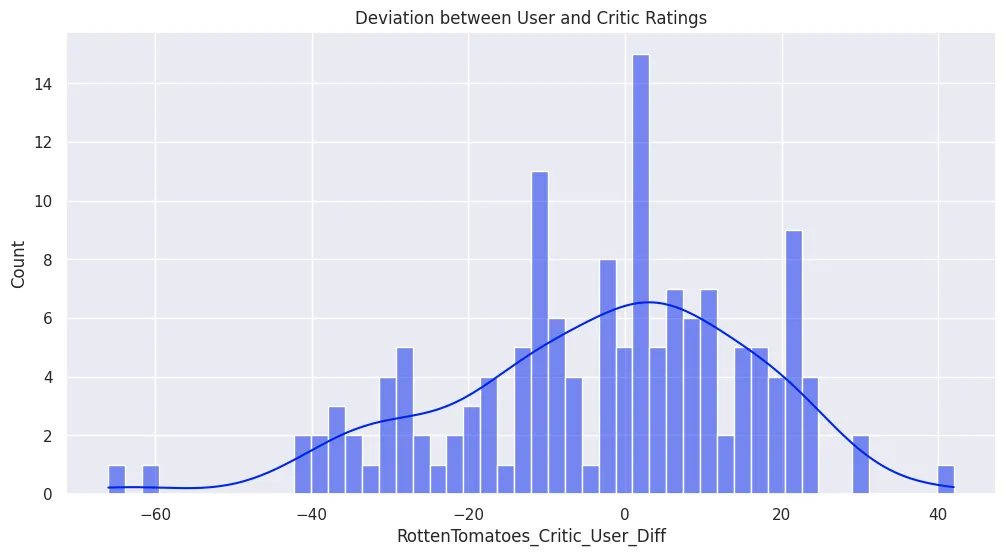
# what is the average absolute deviation between user and critic scores?
all_sites_df['RottenTomatoes_Critic_User_Diff'].apply(abs).mean()
# 15.095890410958905
plt.figure(figsize=(10, 5))
plt.title('Distribution of Deviation in User and Critic Ratings')

sns.histplot(
    data=all_sites_df,
    x='RottenTomatoes_Critic_User_Diff',
    bins=20,
    kde=True
)

plt.savefig('assets/FiveThirtyEight_Fandango_Dataset_09c.webp', bbox_inches='tight')
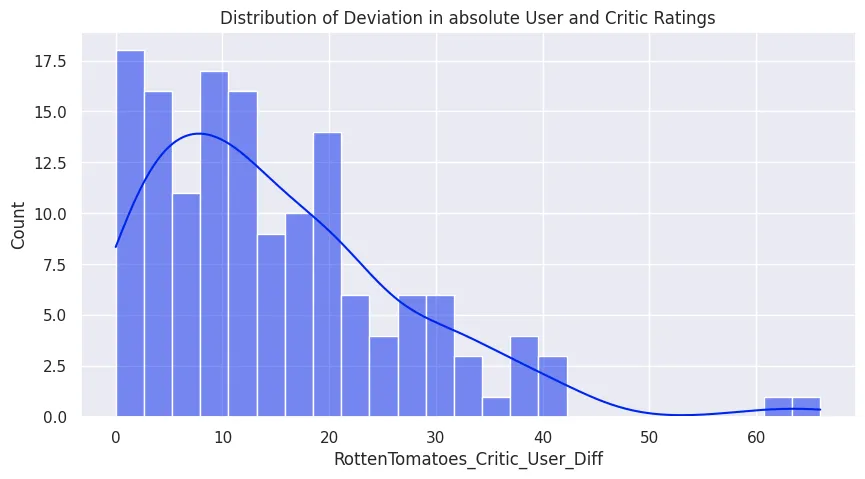
plt.figure(figsize=(10, 5))
plt.title('Distribution of Deviation in absolute User and Critic Ratings')

sns.histplot(
    x=all_sites_df['RottenTomatoes_Critic_User_Diff'].apply(abs),
    bins=25,
    kde=True
)

plt.savefig('assets/FiveThirtyEight_Fandango_Dataset_09d.webp', bbox_inches='tight')
# what movies have the largest neg difference in critics - user?
all_sites_df.sort_values(
    by='RottenTomatoes_Critic_User_Diff',
    ascending=True)[
    ['FILM','RottenTomatoes_Critic_User_Diff']
].head(10)
- Movies loved by RT Users but disliked by Critics: | | FILM | RottenTomatoes_Critic_User_Diff | | -- | -- | -- | | 3 | Do You Believe? (2015) | -66 | | 85 | Little Boy (2015) | -61 | | 134 | The Longest Ride (2015) | -42 | | 105 | Hitman: Agent 47 (2015) | -42 | | 125 | The Wedding Ringer (2015) | -39 | | 132 | Max (2015) | -38 | | 19 | Pixels (2015) | -37 | | 15 | Taken 3 (2015) | -37 | | 51 | Entourage (2015) | -36 | | 49 | Terminator Genisys (2015) | -34 |
# what movies have the largest pos difference in critics - user?
all_sites_df.sort_values(by='RottenTomatoes_Critic_User_Diff', ascending=False)[['FILM','RottenTomatoes_Critic_User_Diff']].head(10)
- Movies loved by Critics but disliked by RT Users:
| FILM | RottenTomatoes_Critic_User_Diff | |
|---|---|---|
| 69 | Mr. Turner (2014) | 42 |
| 112 | It Follows (2015) | 31 |
| 115 | While We're Young (2015) | 31 |
| 145 | Kumiko, The Treasure Hunter (2015) | 24 |
| 37 | Welcome to Me (2015) | 24 |
| 40 | I'll See You In My Dreams (2015) | 24 |
| 90 | The SpongeBob Movie: Sponge Out of Water (2015) | 23 |
| 7 | Top Five (2014) | 22 |
| 11 | Black Sea (2015) | 22 |
| 116 | Clouds of Sils Maria (2015) | 22 |
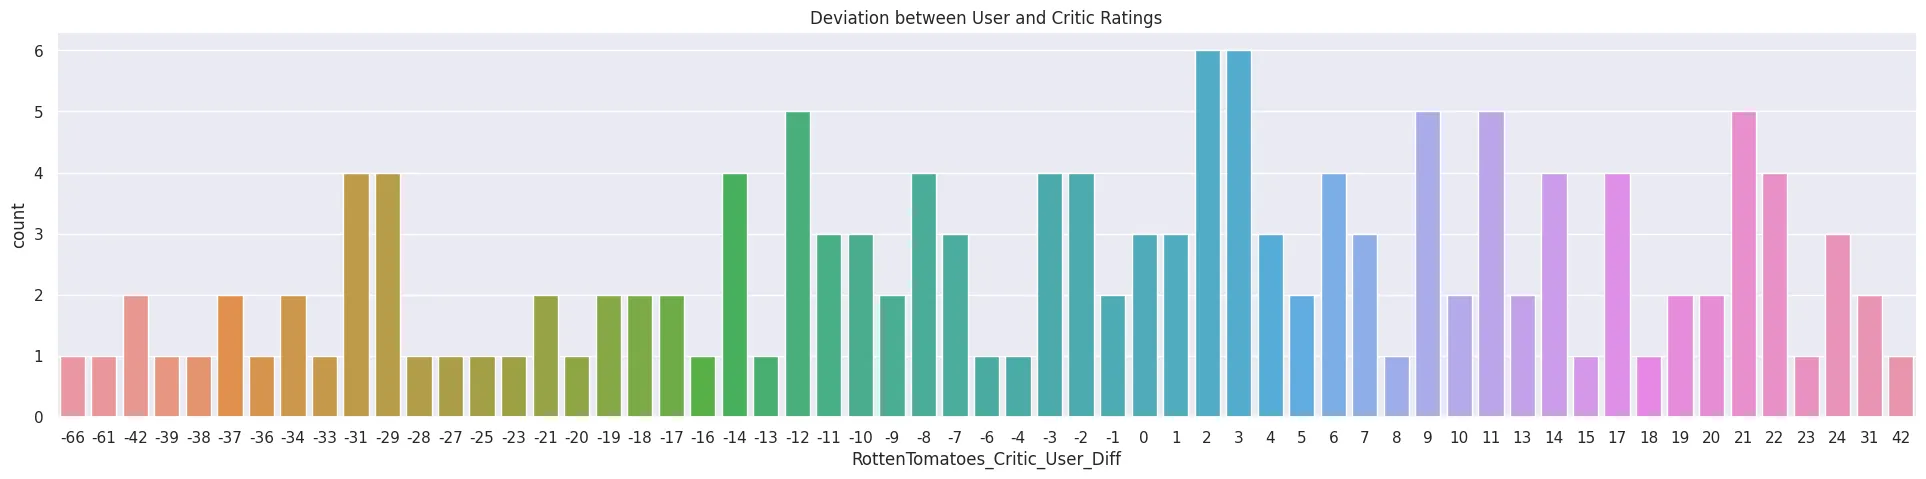
plt.figure(figsize=(24, 5))
plt.title('Deviation between User and Critic Ratings')

plot = sns.countplot(
    data=all_sites_df,
    x='RottenTomatoes_Critic_User_Diff'
)

plt.savefig('assets/FiveThirtyEight_Fandango_Dataset_10.webp', bbox_inches='tight')
plt.figure(figsize=(12, 6))
plt.title('Deviation between User and Critic Ratings')

plot = sns.histplot(
    data=all_sites_df,
    bins=50,
    x='RottenTomatoes_Critic_User_Diff',
    kde=True
)

plt.savefig('assets/FiveThirtyEight_Fandango_Dataset_11.webp', bbox_inches='tight')
MetaCritic
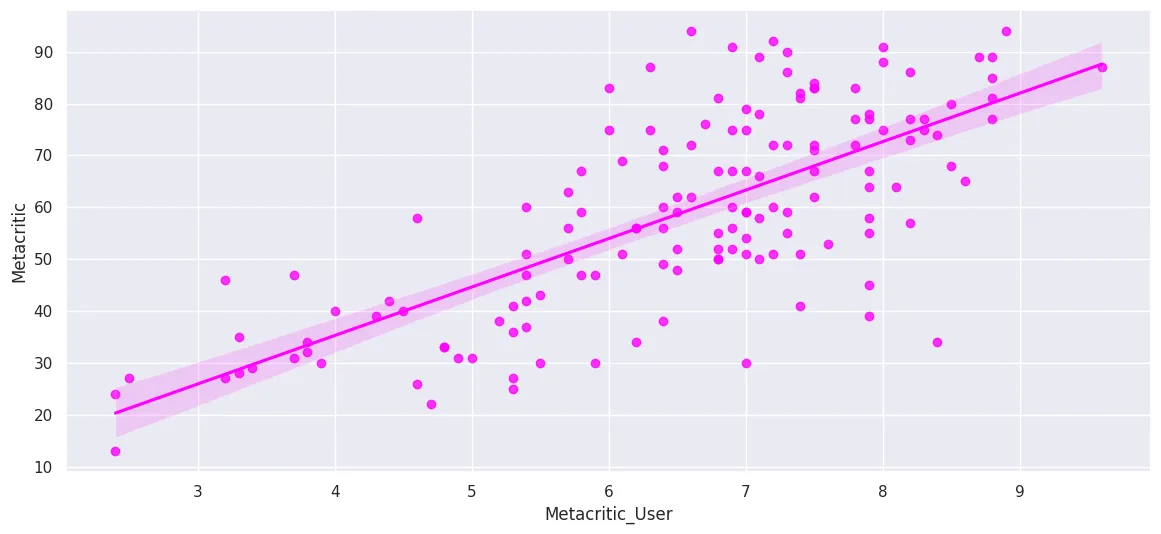
plt.figure(figsize=(14, 6))

sns.regplot(
    x='Metacritic_User',
    y='Metacritic',
    data=all_sites_df,
    ci=95,
    n_boot=1000,
    color='fuchsia'
)

plt.savefig('assets/FiveThirtyEight_Fandango_Dataset_12a.webp', bbox_inches='tight')

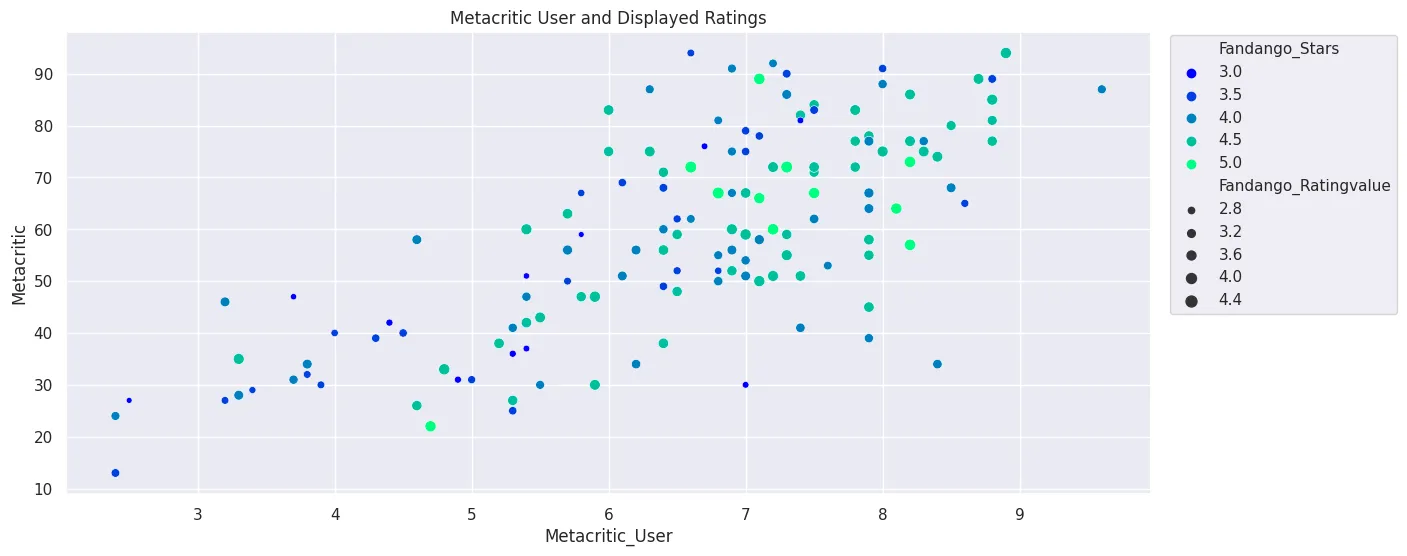
plt.figure(figsize=(14, 6))

sns.scatterplot(
    x='Metacritic_User',
    y='Metacritic',
    data=all_sites_df,
    hue='Fandango_Stars',
    palette='winter',
    size='Fandango_Ratingvalue'
).set_title('Metacritic User and Displayed Ratings')

plt.legend(bbox_to_anchor=(1.01,1.01))
plt.savefig('assets/FiveThirtyEight_Fandango_Dataset_12b.webp', bbox_inches='tight')
IMDB
plt.figure(figsize=(14, 6))

sns.regplot(
    x='Metacritic_User',
    y='Metacritic',
    data=all_sites_df,
    ci=95,
    n_boot=1000,
    color='fuchsia'
)

plt.savefig('assets/FiveThirtyEight_Fandango_Dataset_13a.webp', bbox_inches='tight')
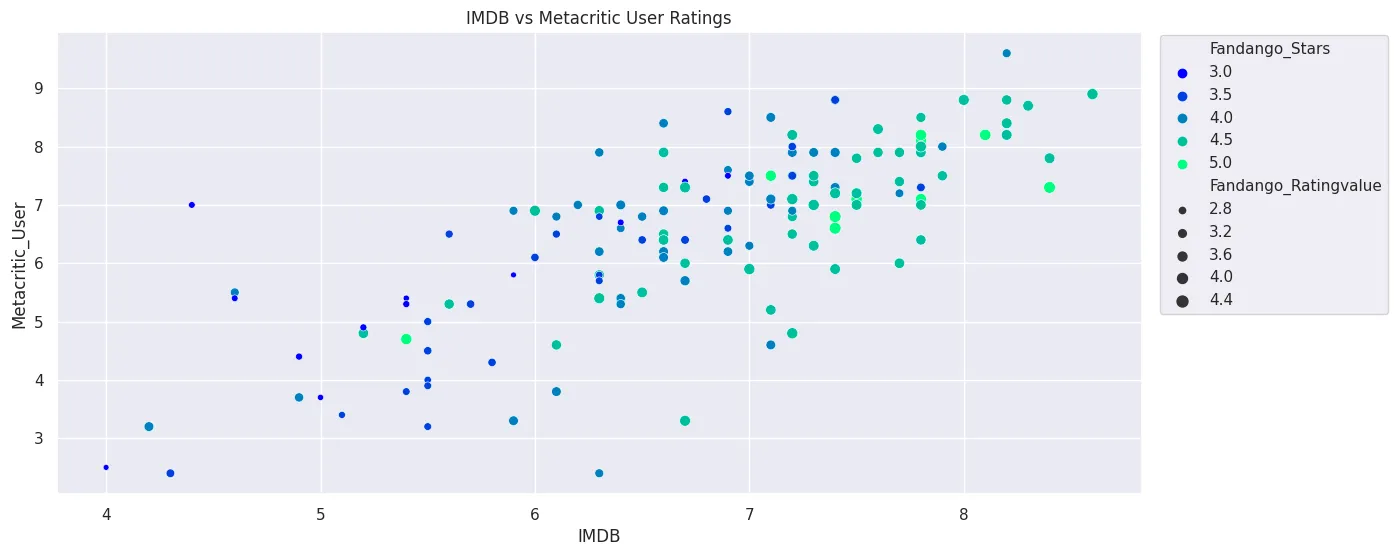
plt.figure(figsize=(14, 6))

sns.scatterplot(
    x='IMDB',
    y='Metacritic_User',
    data=all_sites_df,
    hue='Fandango_Stars',
    palette='winter',
    size='Fandango_Ratingvalue'
).set_title('IMDB vs Metacritic User Ratings')

plt.legend(bbox_to_anchor=(1.01,1.01))
plt.savefig('assets/FiveThirtyEight_Fandango_Dataset_13b.webp', bbox_inches='tight')
Normalizing the Datasets
all_sites_df.describe()
# Rotten Tomatoes: 0-100
# Rotten Tomatoes Users: 0-100
# Metacritic: 0-100
# Metacritic User: 0-10
# IMDB: 0-10
# Fandango Stars: 0-5
# Fandango Rating: 0-5
| RottenTomatoes | RottenTomatoes_User | Metacritic | Metacritic_User | IMDB | Fandango_Stars | Fandango_Ratingvalue | |
|---|---|---|---|---|---|---|---|
| count | 146.000000 | 146.000000 | 146.000000 | 146.000000 | 146.000000 | 146.000000 | 146.000000 |
| mean | 60.849315 | 63.876712 | 58.808219 | 6.519178 | 6.736986 | 4.089041 | 3.845205 |
| std | 30.168799 | 20.024430 | 19.517389 | 1.510712 | 0.958736 | 0.540386 | 0.502831 |
| min | 5.000000 | 20.000000 | 13.000000 | 2.400000 | 4.000000 | 3.000000 | 2.700000 |
| 25% | 31.250000 | 50.000000 | 43.500000 | 5.700000 | 6.300000 | 3.500000 | 3.500000 |
| 50% | 63.500000 | 66.500000 | 59.000000 | 6.850000 | 6.900000 | 4.000000 | 3.900000 |
| 75% | 89.000000 | 81.000000 | 75.000000 | 7.500000 | 7.400000 | 4.500000 | 4.200000 |
| max | 100.000000 | 94.000000 | 94.000000 | 9.600000 | 8.600000 | 5.000000 | 4.800000 |
# Normalized to the Fandango 0-5 rating system
all_sites_df['RottenTomatoes_Normalized'] = (all_sites_df['RottenTomatoes'] / 20).round(2)
all_sites_df['RottenTomatoes_User_Normalized'] = (all_sites_df['RottenTomatoes_User'] / 20).round(2)
all_sites_df['Metacritic_Normalized'] = (all_sites_df['Metacritic'] / 20).round(2)
all_sites_df['Metacritic_User_Normalized'] = (all_sites_df['Metacritic_User'] / 2).round(2)
all_sites_df['IMDB_Normalized'] = (all_sites_df['IMDB'] / 2).round(2)
all_sites_normed_ratings_df = all_sites_df[[
    'RottenTomatoes_Normalized',
    'RottenTomatoes_User_Normalized',
    'Metacritic_Normalized',
    'Metacritic_User_Normalized',
    'IMDB_Normalized',
    'Fandango_Stars',
    'Fandango_Ratingvalue'

]]

all_sites_normed_ratings_df.head(1).T
| 0 | |
|---|---|
| RottenTomatoes_Normalized | 3.70 |
| RottenTomatoes_User_Normalized | 4.30 |
| Metacritic_Normalized | 3.30 |
| Metacritic_User_Normalized | 3.55 |
| IMDB_Normalized | 3.90 |
| Fandango_Stars | 5.00 |
| Fandango_Ratingvalue | 4.50 |
# move legend in kdeplot
def move_legend(ax, new_loc, **kws):
    old_legend = ax.legend_
    handles = old_legend.legendHandles
    labels = [t.get_text() for t in old_legend.get_texts()]
    title = old_legend.get_title().get_text()
    ax.legend(handles, labels, loc=new_loc, title=title, **kws)
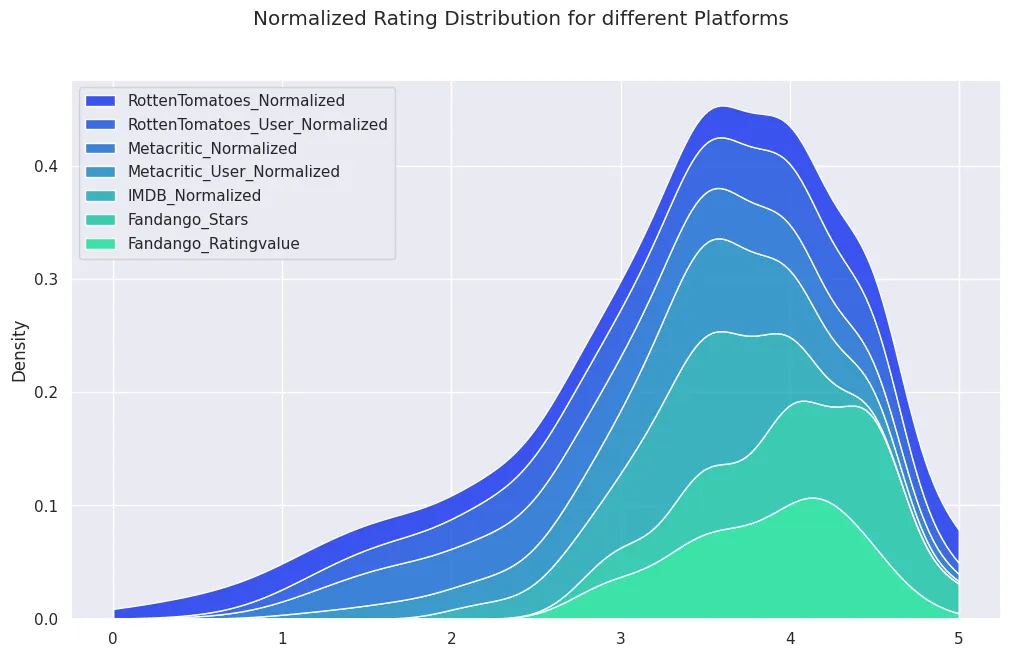
# do all the ratings follow the same distribution?
fig, ax = plt.subplots(figsize=(12, 7))
fig.suptitle('Normalized Rating Distribution for different Platforms')

plot = sns.kdeplot(
    data=all_sites_normed_ratings_df,
    multiple='stack',
    palette='winter',
    clip=[0,5]
)

move_legend(ax, "upper left")
plt.savefig('assets/FiveThirtyEight_Fandango_Dataset_14.webp', bbox_inches='tight')
# the fandango distribution leans towards higher ratings
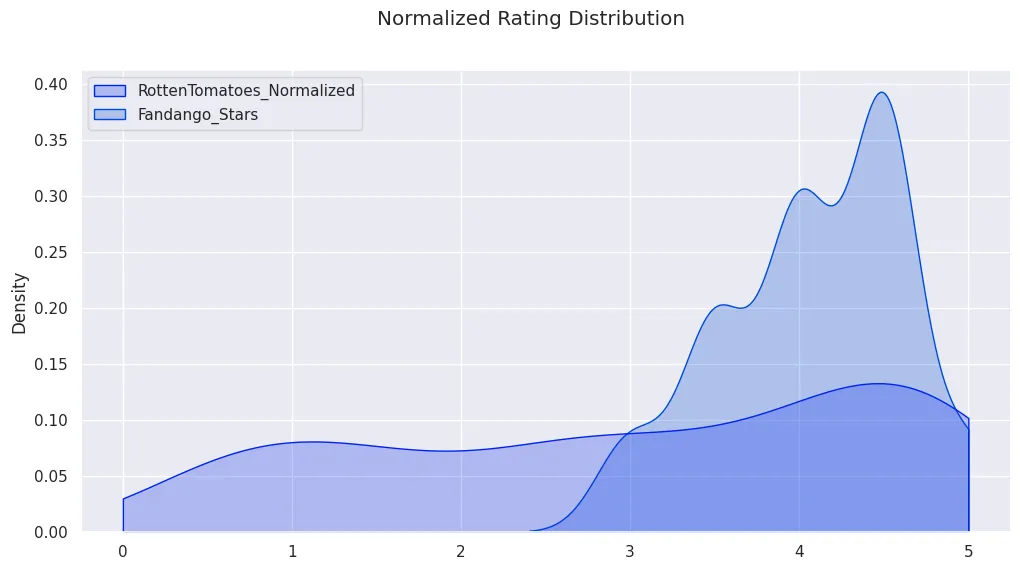
fig, ax = plt.subplots(figsize=(12,6))
sns.kdeplot(
    clip=[0,5],
    fill=True,
    data=all_sites_normed_ratings_df[
        ['RottenTomatoes_Normalized','Fandango_Stars']
    ]
)

fig.suptitle('Normalized Rating Distribution')

move_legend(ax, "upper left")
plt.savefig('assets/FiveThirtyEight_Fandango_Dataset_15.webp', bbox_inches='tight')
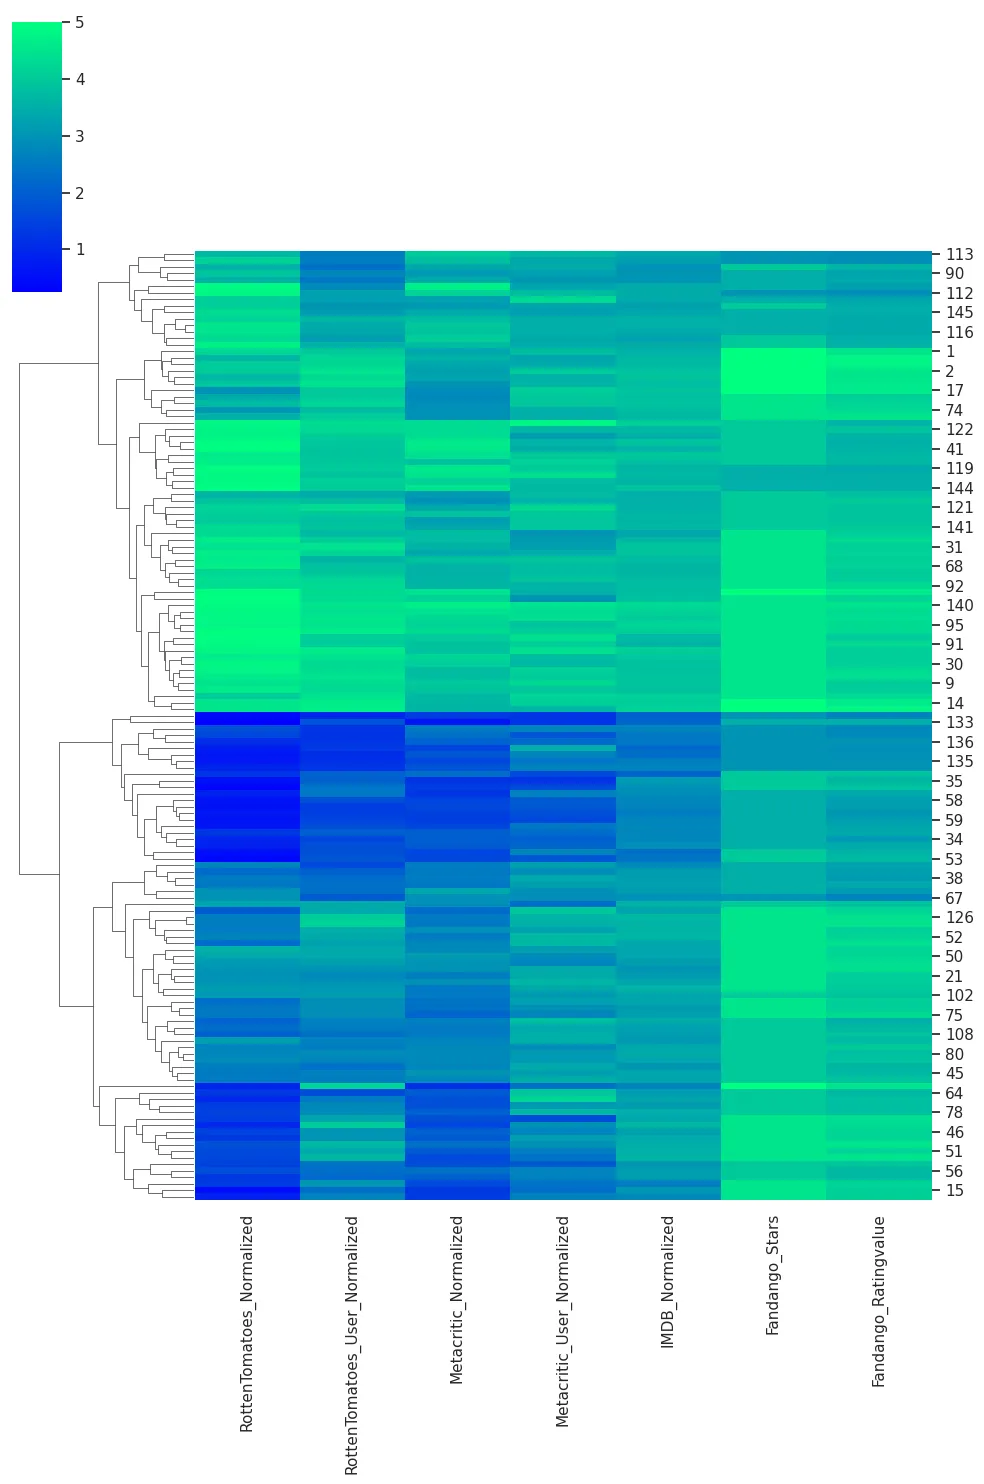
sns.clustermap(
    all_sites_normed_ratings_df,
    figsize=(10, 15),
    cmap='winter',
    annot=False,
    col_cluster=False
)

plt.savefig('assets/FiveThirtyEight_Fandango_Dataset_16.webp', bbox_inches='tight')
# the clustermap groups movies together by rating. the fandango ratings in the lower right are
# all higher (green instead of a blue hue) compared to the rest of the ratings from other platforms
# compare the top10 worst rated movies
worts_10_df = all_sites_normed_ratings_df.sort_values(
    by='Fandango_Stars', ascending=False
).tail(10)

worts_10_df
| RottenTomatoes_Normalized | RottenTomatoes_User_Normalized | Metacritic_Normalized | Metacritic_User_Normalized | IMDB_Normalized | Fandango_Stars | Fandango_Ratingvalue | |
|---|---|---|---|---|---|---|---|
| 67 | 3.00 | 1.95 | 2.95 | 2.90 | 2.95 | 3.0 | 2.7 |
| 101 | 0.80 | 1.35 | 1.50 | 3.50 | 2.20 | 3.0 | 2.9 |
| 136 | 1.10 | 1.25 | 2.10 | 2.20 | 2.45 | 3.0 | 3.0 |
| 135 | 0.70 | 1.15 | 1.55 | 2.45 | 2.60 | 3.0 | 3.0 |
| 115 | 4.15 | 2.60 | 3.80 | 3.35 | 3.20 | 3.0 | 2.9 |
| 107 | 0.65 | 1.05 | 1.85 | 2.70 | 2.30 | 3.0 | 2.9 |
| 112 | 4.80 | 3.25 | 4.15 | 3.75 | 3.45 | 3.0 | 2.9 |
| 113 | 3.65 | 2.60 | 4.05 | 3.70 | 3.35 | 3.0 | 2.9 |
| 48 | 0.45 | 1.00 | 1.35 | 1.25 | 2.00 | 3.0 | 2.7 |
| 82 | 1.70 | 1.25 | 2.55 | 2.70 | 2.70 | 3.0 | 2.8 |
# get movie names
all_sites_df[
    ['FILM','Fandango_Stars','RottenTomatoes_User']
].iloc[
    [67, 101, 136, 135, 115, 107, 112, 113, 48, 82]
]
| FILM | Fandango_Stars | RottenTomatoes_User | |
|---|---|---|---|
| 67 | Unfriended (2015) | 3.0 | 39 |
| 101 | The Gallows (2015) | 3.0 | 27 |
| 136 | The Woman In Black 2 Angel of Death (2015) | 3.0 | 25 |
| 135 | The Lazarus Effect (2015) | 3.0 | 23 |
| 115 | While We're Young (2015) | 3.0 | 52 |
| 107 | The Vatican Tapes (2015) | 3.0 | 21 |
| 112 | It Follows (2015) | 3.0 | 65 |
| 113 | Inherent Vice (2014) | 3.0 | 52 |
| 48 | Fantastic Four (2015) | 3.0 | 20 |
| 82 | Blackhat (2015) | 3.0 | 25 |
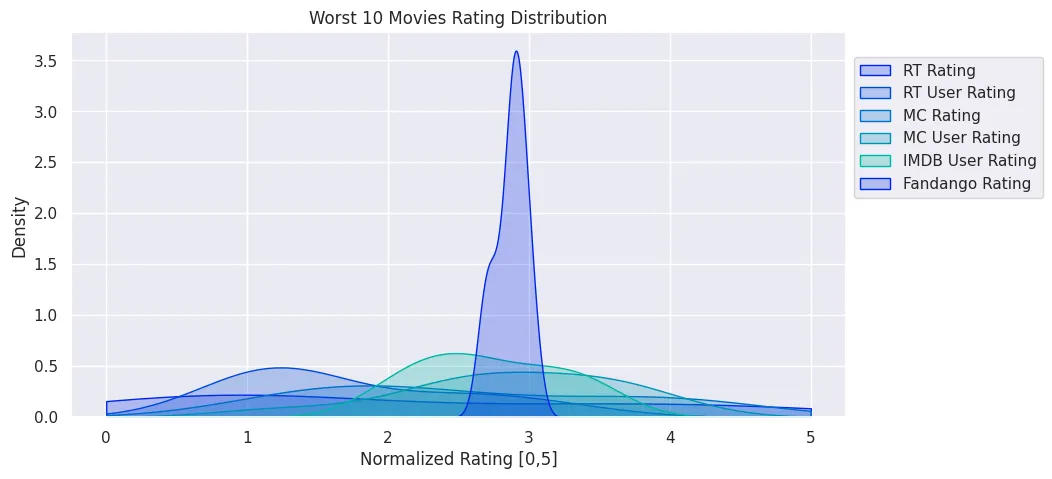
# do ratings and star follow the same distribution?
plt.figure(figsize=(10, 5))
plt.title('Worst 10 Movies Rating Distribution')

sns.kdeplot(
    data=worts_10_df,
    x='RottenTomatoes_Normalized',
    clip=[0,5],
    fill=True,
    label='RT Rating'
)
sns.kdeplot(
    data=worts_10_df,
    x='RottenTomatoes_User_Normalized',
    clip=[0,5],
    fill=True,
    label='RT User Rating'
)
sns.kdeplot(
    data=worts_10_df,
    x='Metacritic_Normalized',
    clip=[0,5],
    fill=True,
    label='MC Rating'
)
sns.kdeplot(
    data=worts_10_df,
    x='Metacritic_User_Normalized',
    clip=[0,5],
    fill=True,
    label='MC User Rating'
)
sns.kdeplot(
    data=worts_10_df,
    x='IMDB_Normalized',
    clip=[0,5],
    fill=True,
    label='IMDB User Rating'
)
sns.kdeplot(
    data=worts_10_df,
    x='Fandango_Stars',
    clip=[0,5],
    fill=True,
    label='Fandango Stars'
)
sns.kdeplot(
    data=worts_10_df,
    x='Fandango_Ratingvalue',
    clip=[0,5],
    fill=True,
    label='Fandango Rating'
)

plt.legend(loc=(1.01, 0.57))
plt.xlabel('Normalized Rating [0,5]')
plt.savefig('assets/FiveThirtyEight_Fandango_Dataset_18.webp', bbox_inches='tight')

# fandango groups all movies with ratings below 3 in the 3-star category
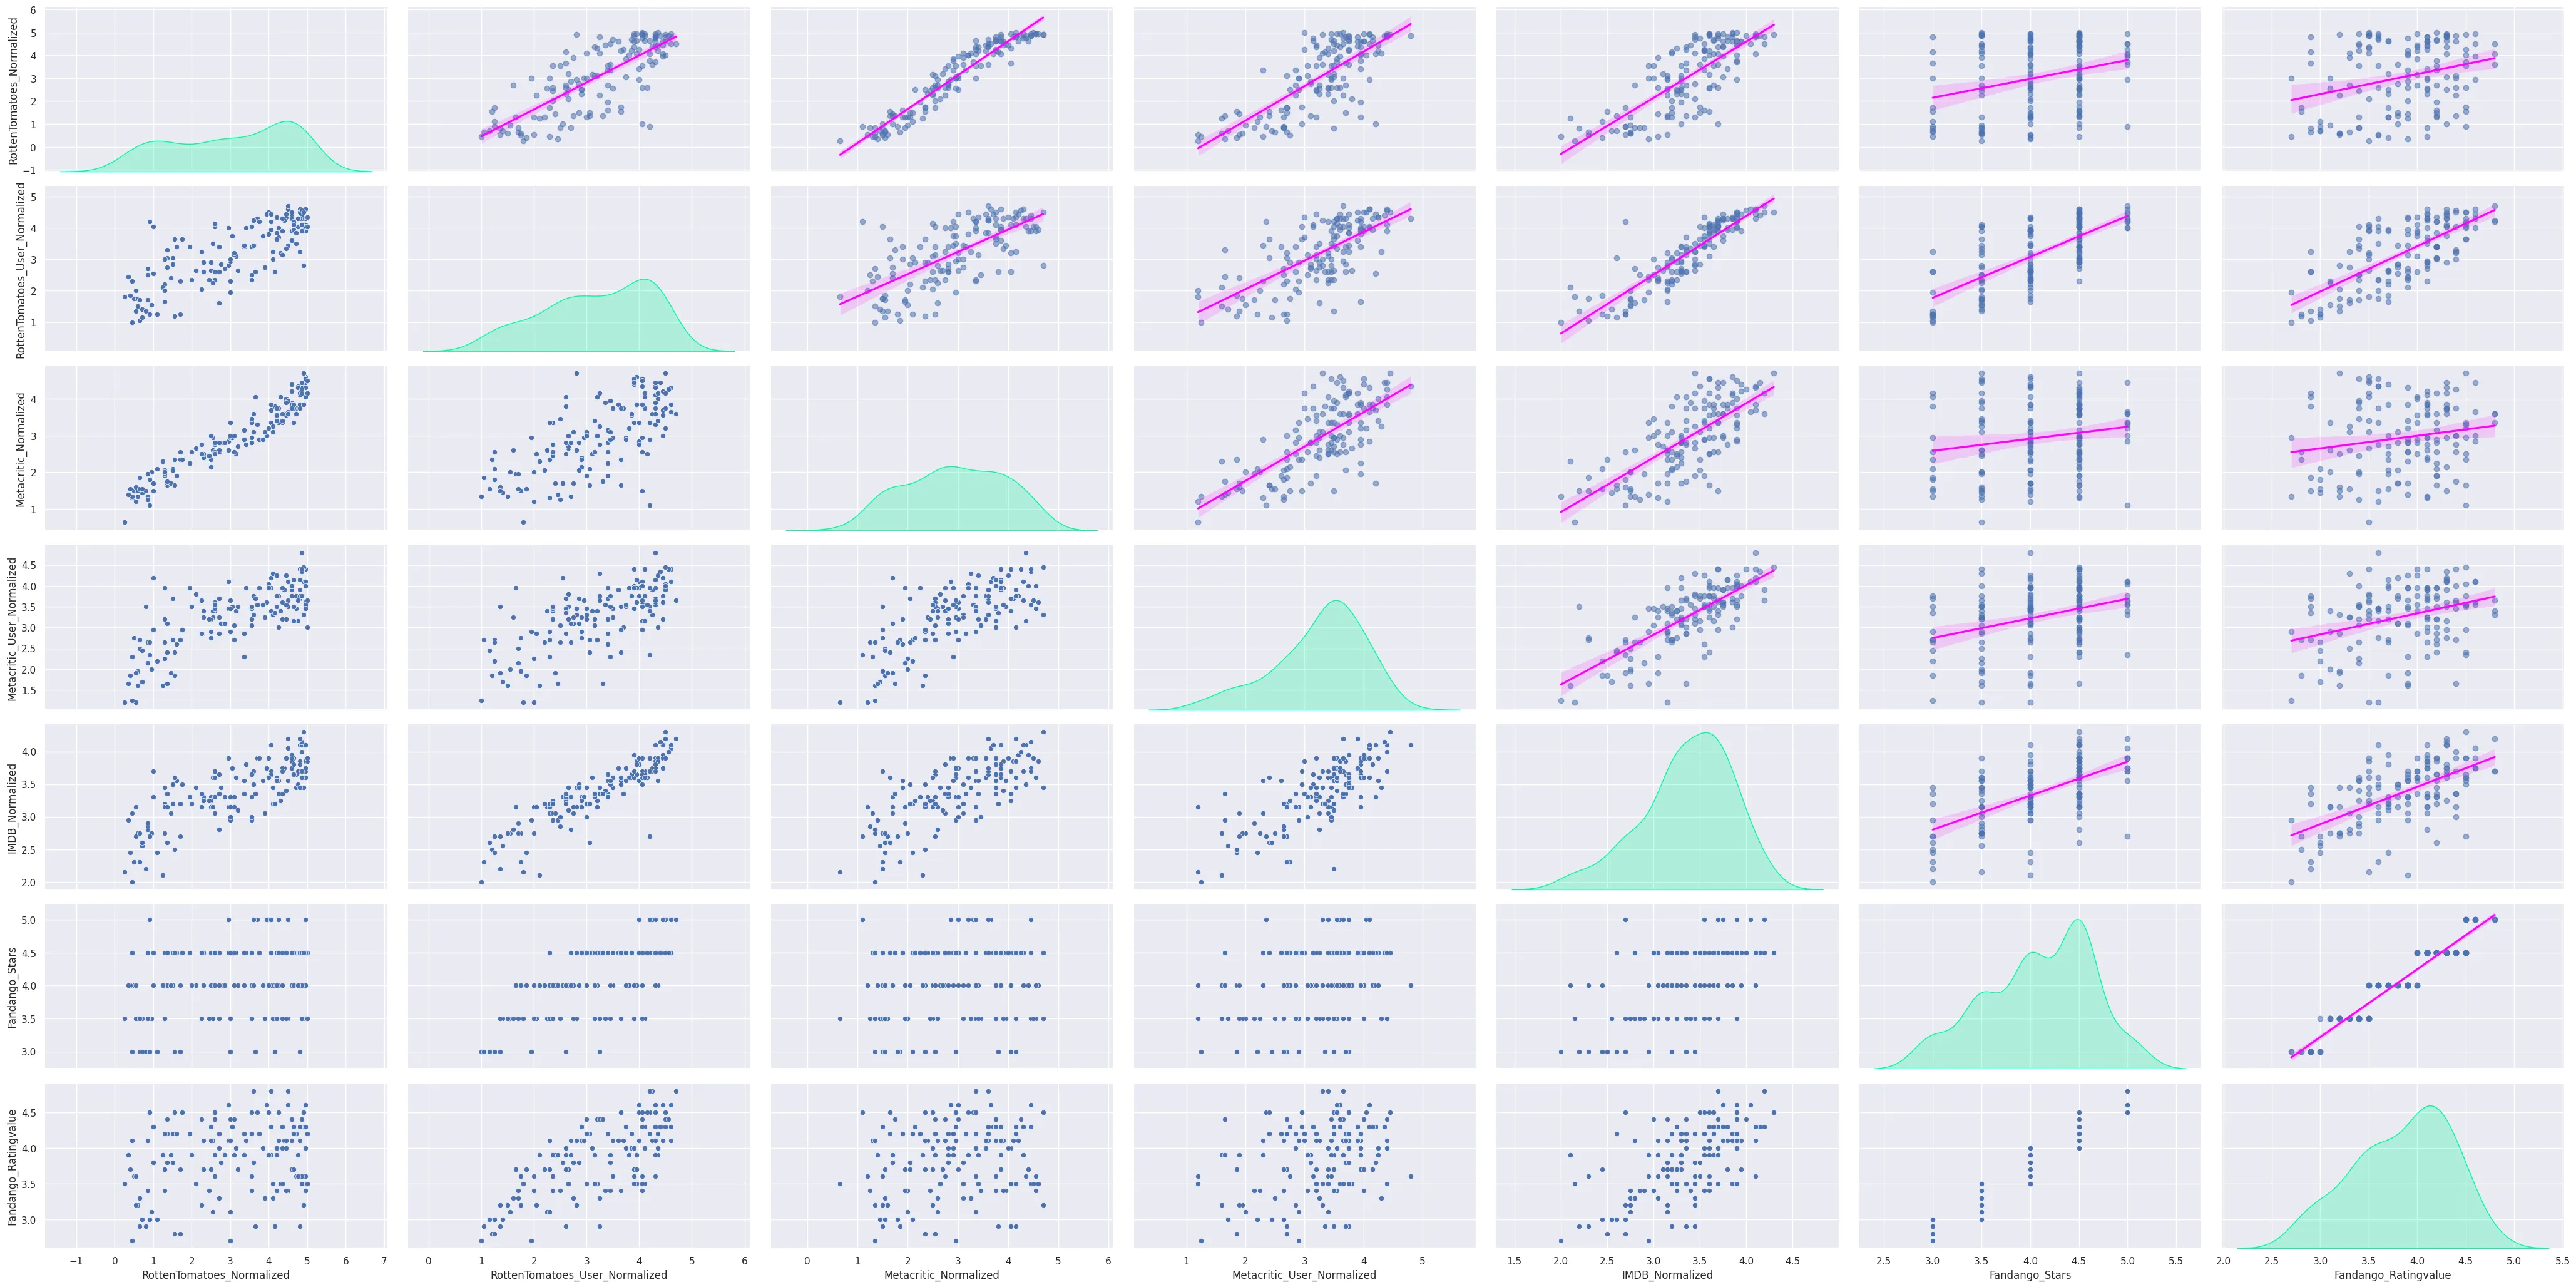
grid = sns.PairGrid(
    data=all_sites_normed_ratings_df,
    height=3,
    aspect=2,
    despine=True
)

grid = grid.map_upper(
    sns.regplot,
    scatter_kws={'alpha':0.55},
    line_kws={'color': 'fuchsia'}
)
grid = grid.map_lower(sns.scatterplot)
grid = grid.map_diag(sns.kdeplot, color='mediumspringgreen', fill=True)


plt.savefig('assets/FiveThirtyEight_Fandango_Dataset_17.webp', bbox_inches='tight')