
Telco Customer Churn Cohort Study
import numpy as np
import matplotlib.pyplot as plt
import pandas as pd
import seaborn as sns
from sklearn import svm
from sklearn.ensemble import (
    RandomForestClassifier,
    GradientBoostingClassifier,
    AdaBoostClassifier
)
from sklearn.metrics import (
    classification_report,
    confusion_matrix,
    ConfusionMatrixDisplay,
)
from sklearn.model_selection import (
    train_test_split,
    GridSearchCV
)
from sklearn.tree import DecisionTreeClassifier
from sklearn.preprocessing import StandardScaler
!wget https://github.com/mpolinowski/datasets/raw/master/telco_customer_churn.csv -P dataset
telco_df = pd.read_csv('dataset/telco_customer_churn.csv')
telco_df.head(5).transpose()
| 0 | 1 | 2 | 3 | 4 | |
|---|---|---|---|---|---|
| gender | Female | Male | Male | Male | Female |
| SeniorCitizen | 0 | 0 | 0 | 0 | 0 |
| Partner | Yes | No | No | No | No |
| Dependents | No | No | No | No | No |
| tenure | 1 | 34 | 2 | 45 | 2 |
| PhoneService | No | Yes | Yes | No | Yes |
| MultipleLines | No phone service | No | No | No phone service | No |
| InternetService | DSL | DSL | DSL | DSL | Fiber optic |
| OnlineSecurity | No | Yes | Yes | Yes | No |
| OnlineBackup | Yes | No | Yes | No | No |
| DeviceProtection | No | Yes | No | Yes | No |
| TechSupport | No | No | No | Yes | No |
| StreamingTV | No | No | No | No | No |
| StreamingMovies | No | No | No | No | No |
| Contract | Month-to-month | One year | Month-to-month | One year | Month-to-month |
| PaperlessBilling | Yes | No | Yes | No | Yes |
| PaymentMethod | Electronic check | Mailed check | Mailed check | Bank transfer (automatic) | Electronic check |
| MonthlyCharges | 29.85 | 56.95 | 53.85 | 42.3 | 70.7 |
| TotalCharges | 29.85 | 1889.5 | 108.15 | 1840.75 | 151.65 |
| Churn | No | No | Yes | No | Yes |
Feature Exploration
# check for missing data or wrong dtype
telco_df.info()
<class 'pandas.core.frame.DataFrame'>
RangeIndex: 7043 entries, 0 to 7042 Data columns (total 20 columns):
| # | Column | Non-Null Count | Dtype |
|---|---|---|---|
| 0 | gender | 7043 non-null | object |
| 1 | SeniorCitizen | 7043 non-null | int64 |
| 2 | Partner | 7043 non-null | object |
| 3 | Dependents | 7043 non-null | object |
| 4 | tenure | 7043 non-null | int64 |
| 5 | PhoneService | 7043 non-null | object |
| 6 | MultipleLines | 7043 non-null | object |
| 7 | InternetService | 7043 non-null | object |
| 8 | OnlineSecurity | 7043 non-null | object |
| 9 | OnlineBackup | 7043 non-null | object |
| 10 | DeviceProtection | 7043 non-null | object |
| 11 | TechSupport | 7043 non-null | object |
| 12 | StreamingTV | 7043 non-null | object |
| 13 | StreamingMovies | 7043 non-null | object |
| 14 | Contract | 7043 non-null | object |
| 15 | PaperlessBilling | 7043 non-null | object |
| 16 | PaymentMethod | 7043 non-null | object |
| 17 | MonthlyCharges | 7043 non-null | float64 |
| 18 | TotalCharges | 7043 non-null | object |
| 19 | Churn | 7043 non-null | object |
| dtypes: float64(1), int64(2), object(17) | |||
| memory usage: 1.1+ MB |
# TotalCharges is type string because it contains SPACE's
# how many rows have a SPACE instad of a float value?
(telco_df['TotalCharges'] == ' ').sum()
# 11
# drop those 11 rows
telco_df = telco_df[telco_df['TotalCharges'] != ' ']
# now turn TotalCharges column into dtype=float
telco_df['TotalCharges'] = telco_df['TotalCharges'].apply(lambda string: float(string))
# Name: TotalCharges, Length: 7032, dtype: float64
# check for missing values
telco_df.isnull().sum()
| gender | 0 |
| SeniorCitizen | 0 |
| Partner | 0 |
| Dependents | 0 |
| tenure | 0 |
| PhoneService | 0 |
| MultipleLines | 0 |
| InternetService | 0 |
| OnlineSecurity | 0 |
| OnlineBackup | 0 |
| DeviceProtection | 0 |
| TechSupport | 0 |
| StreamingTV | 0 |
| StreamingMovies | 0 |
| Contract | 0 |
| PaperlessBilling | 0 |
| PaymentMethod | 0 |
| MonthlyCharges | 0 |
| TotalCharges | 0 |
| Churn | 0 |
| dtype: int64 |
# check label distribution
telco_df['Churn'].value_counts()

# No     5174
# Yes    1869
# Name: Churn, dtype: int64
plt.figure(figsize=(10,4))
plt.title('Churn Count Distribution')
sns.countplot(data=telco_df, x='Churn', palette='seismic')
plt.savefig('assets/telco-customer-churn_01.webp', bbox_inches='tight')

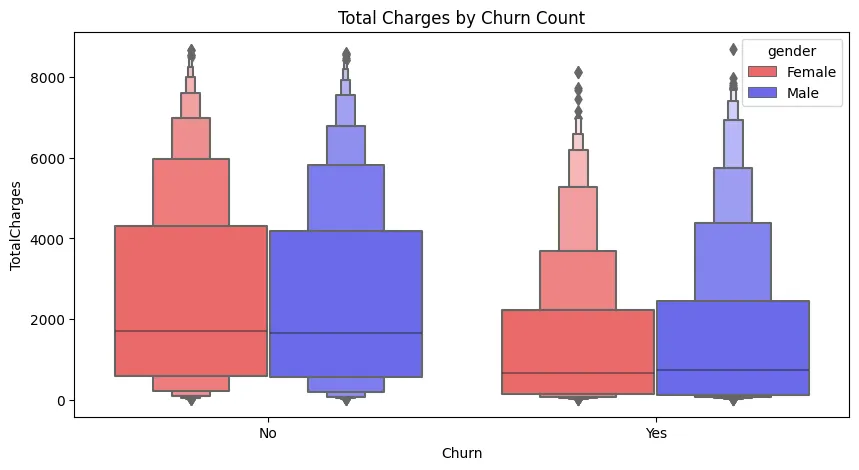
plt.figure(figsize=(10, 5))
plt.title('Total Charges by Churn Count')

sns.boxenplot(
    data=telco_df,
    x='Churn',
    y='TotalCharges',
    hue='gender',
    palette='seismic_r'
)
plt.savefig('assets/telco-customer-churn_02.webp', bbox_inches='tight')
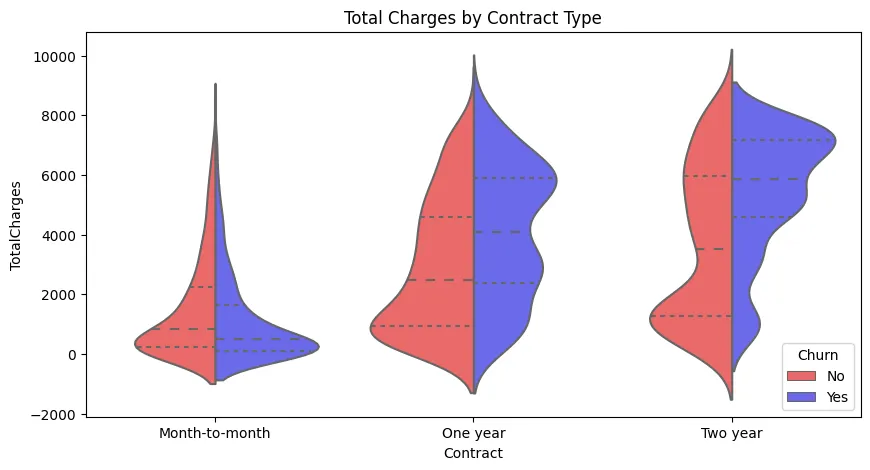
plt.figure(figsize=(10, 5))
plt.title('Total Charges by Contract Type')

sns.violinplot(
    data=telco_df,
    x='Contract',
    y='TotalCharges',
    hue='Churn',
    palette='seismic_r',
    orient='v',
    inner='quartile',
    bw=0.3,
    split=True
)
plt.legend(loc='lower right', title='Churn')
plt.savefig('assets/telco-customer-churn_03.webp', bbox_inches='tight')
# make values numeric to show correlation
telco_df_numeric = pd.get_dummies(telco_df[
    [
        'gender',
        'SeniorCitizen',
        'Partner',
        'Dependents',
        'PhoneService',
        'MultipleLines',
        'InternetService',
        'OnlineSecurity',
        'OnlineBackup',
        'DeviceProtection',
        'TechSupport',
        'StreamingTV',
        'StreamingMovies',
        'Contract',
        'PaperlessBilling',
        'PaymentMethod',
        'Churn'
    ]
], drop_first=True)

telco_df_numeric.head(5).transpose()
| 0 | 1 | 2 | 3 | 4 | |
|---|---|---|---|---|---|
| SeniorCitizen | 0 | 0 | 0 | 0 | 0 |
| gender_Male | 0 | 1 | 1 | 1 | 0 |
| Partner_Yes | 1 | 0 | 0 | 0 | 0 |
| Dependents_Yes | 0 | 0 | 0 | 0 | 0 |
| PhoneService_Yes | 0 | 1 | 1 | 0 | 1 |
| MultipleLines_No phone service | 1 | 0 | 0 | 1 | 0 |
| MultipleLines_Yes | 0 | 0 | 0 | 0 | 0 |
| InternetService_Fiber optic | 0 | 0 | 0 | 0 | 1 |
| InternetService_No | 0 | 0 | 0 | 0 | 0 |
| OnlineSecurity_No internet service | 0 | 0 | 0 | 0 | 0 |
| OnlineSecurity_Yes | 0 | 1 | 1 | 1 | 0 |
| OnlineBackup_No internet service | 0 | 0 | 0 | 0 | 0 |
| OnlineBackup_Yes | 1 | 0 | 1 | 0 | 0 |
| DeviceProtection_No internet service | 0 | 0 | 0 | 0 | 0 |
| DeviceProtection_Yes | 0 | 1 | 0 | 1 | 0 |
| TechSupport_No internet service | 0 | 0 | 0 | 0 | 0 |
| TechSupport_Yes | 0 | 0 | 0 | 1 | 0 |
| StreamingTV_No internet service | 0 | 0 | 0 | 0 | 0 |
| StreamingTV_Yes | 0 | 0 | 0 | 0 | 0 |
| StreamingMovies_No internet service | 0 | 0 | 0 | 0 | 0 |
| StreamingMovies_Yes | 0 | 0 | 0 | 0 | 0 |
| Contract_One year | 0 | 1 | 0 | 1 | 0 |
| Contract_Two year | 0 | 0 | 0 | 0 | 0 |
| PaperlessBilling_Yes | 1 | 0 | 1 | 0 | 1 |
| PaymentMethod_Credit card (automatic) | 0 | 0 | 0 | 0 | 0 |
| PaymentMethod_Electronic check | 1 | 0 | 0 | 0 | 1 |
| PaymentMethod_Mailed check | 0 | 1 | 1 | 0 | 0 |
| Churn_Yes | 0 | 0 | 1 | 0 | 1 |
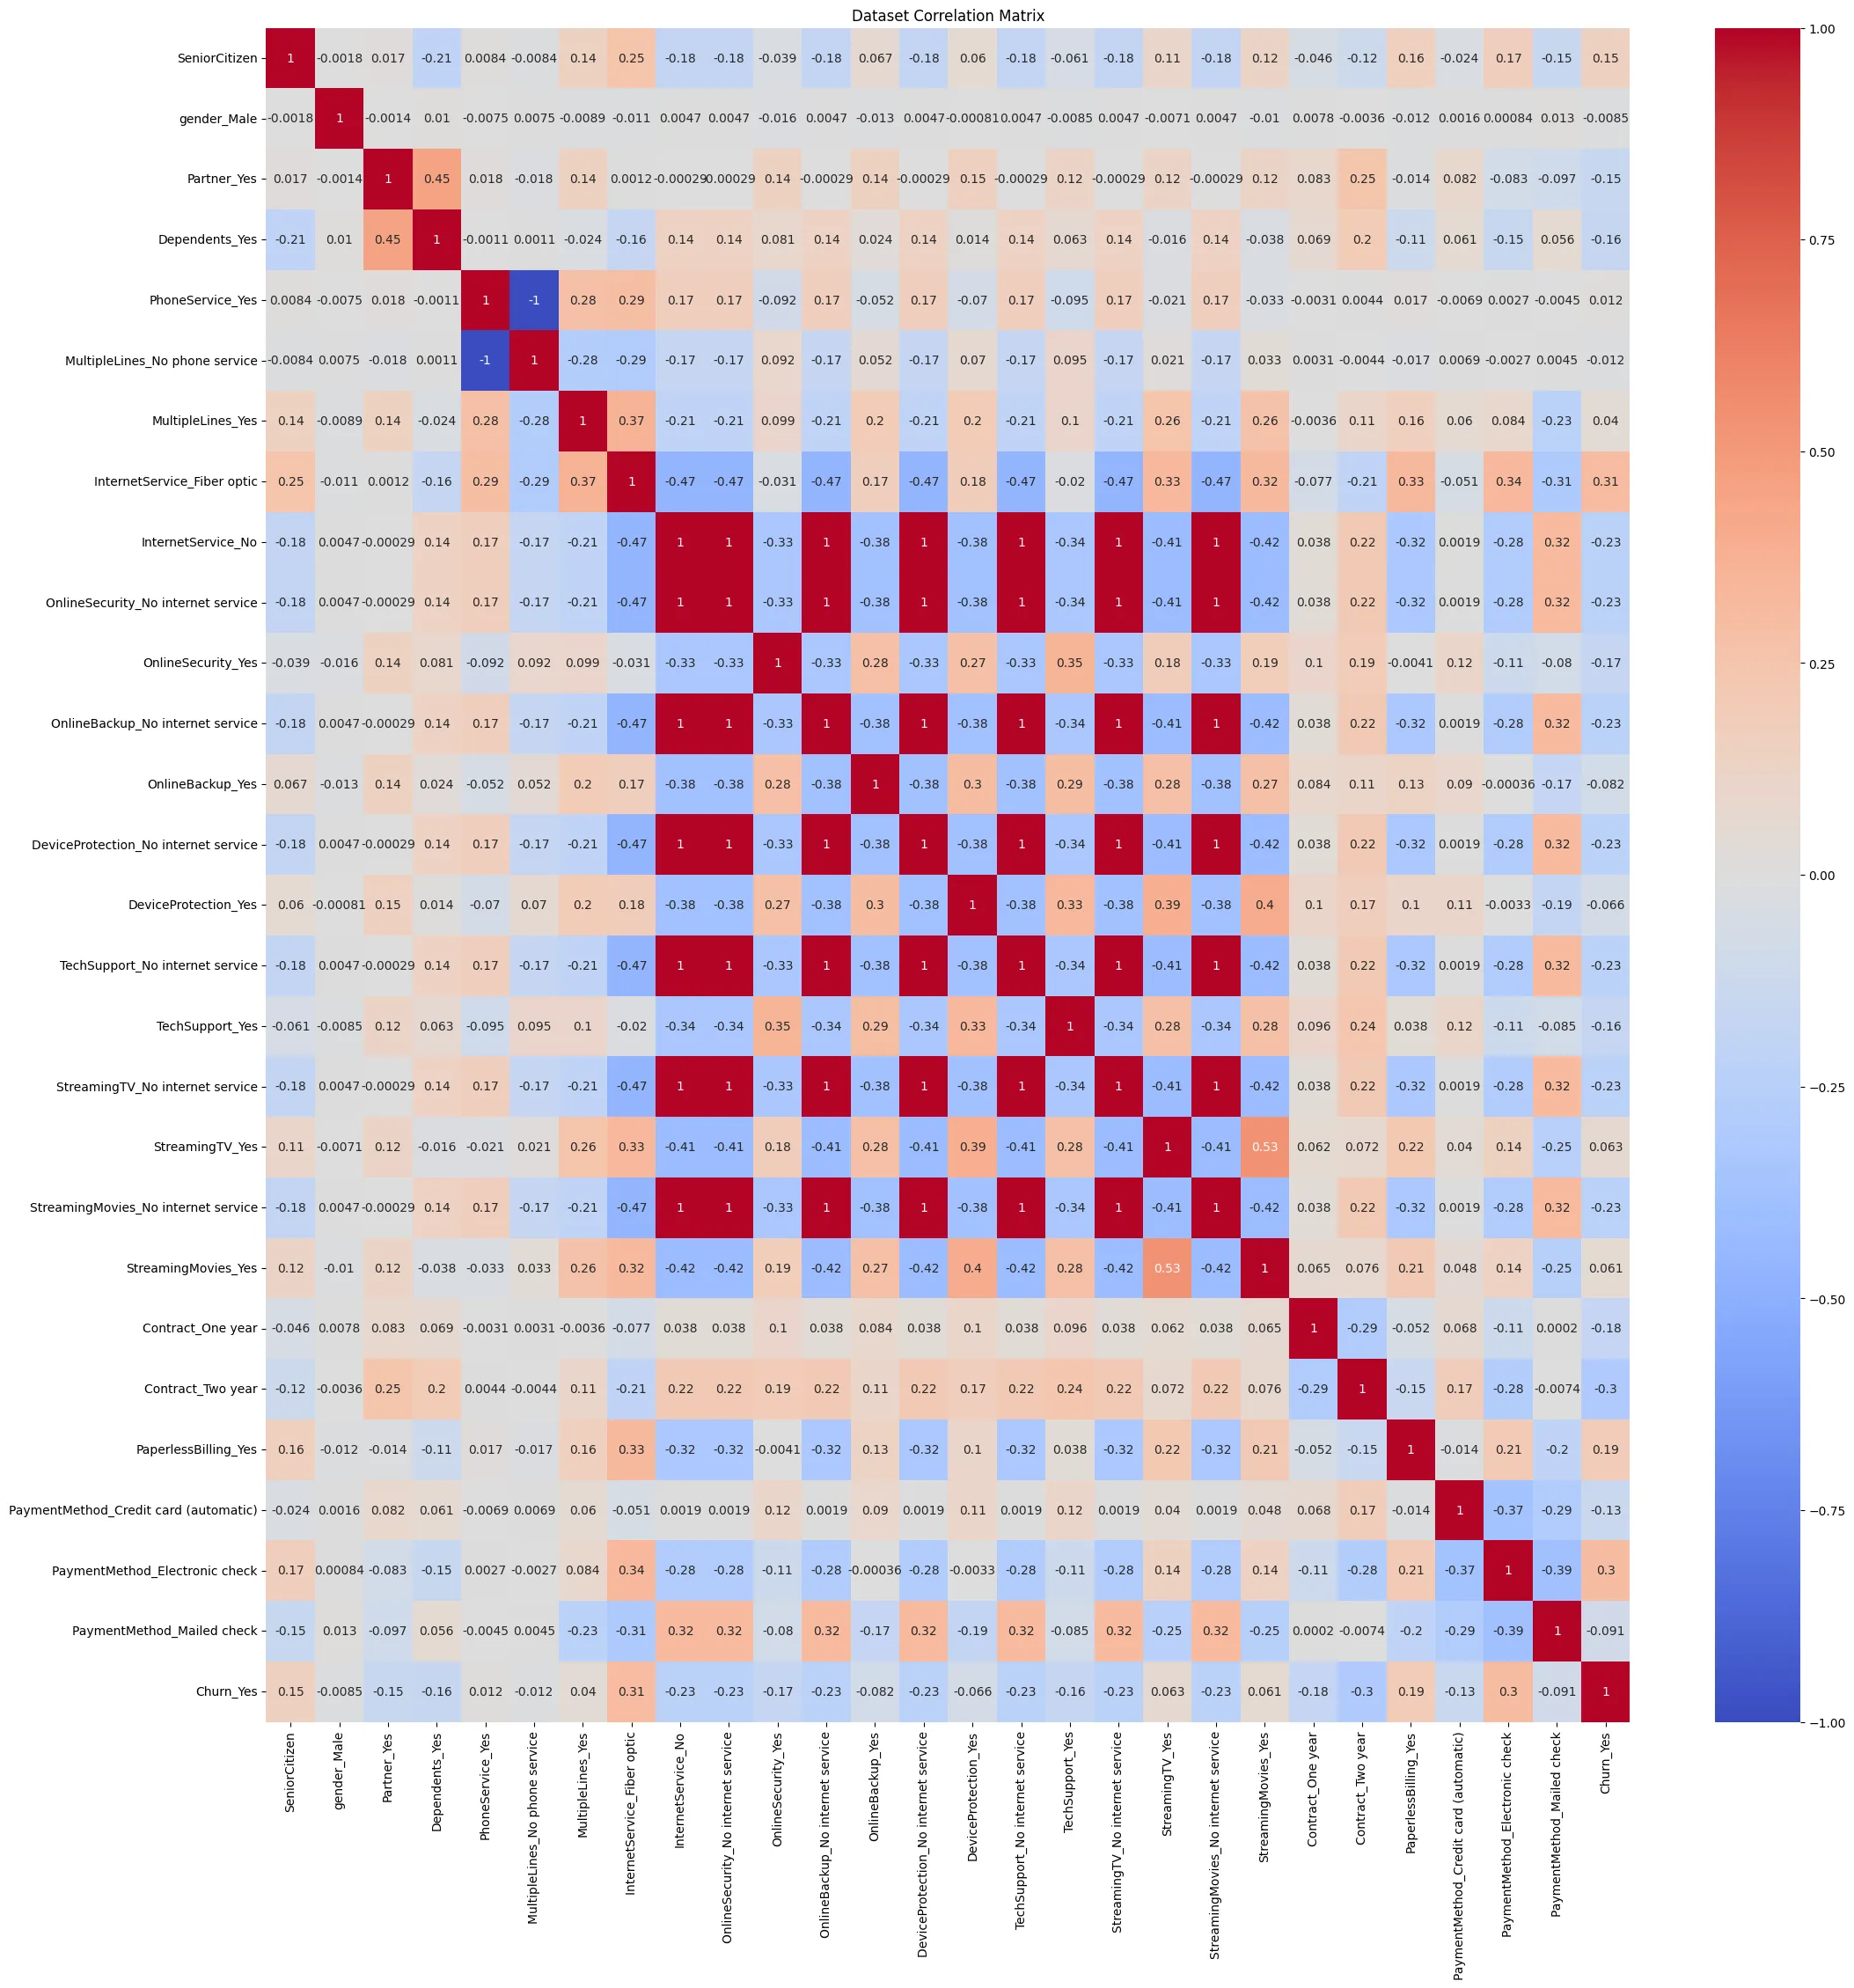
plt.figure(figsize=(25,25))
plt.title('Dataset Correlation Matrix')
sns.heatmap(telco_df_numeric.corr(), annot=True, cmap='coolwarm')
plt.savefig('assets/telco-customer-churn_04.webp', bbox_inches='tight')
# correlation to label class
telco_df_numeric.corr(numeric_only=True)['Churn_Yes']
| SeniorCitizen | 0.150541 |
| gender_Male | -0.008545 |
| Partner_Yes | -0.149982 |
| Dependents_Yes | -0.163128 |
| PhoneService_Yes | 0.011691 |
| MultipleLines_No phone service | - |
| MultipleLines_Yes | 0.040033 |
| InternetService_Fiber optic | 0.307463 |
| InternetService_No | -0.227578 |
| OnlineSecurity_No internet service | -0.227578 |
| OnlineSecurity_Yes | -0.171270 |
| OnlineBackup_No internet service | -0.227578 |
| OnlineBackup_Yes | -0.082307 |
| DeviceProtection_No internet service | -0.227578 |
| DeviceProtection_Yes | -0.066193 |
| TechSupport_No internet service | -0.227578 |
| TechSupport_Yes | -0.164716 |
| StreamingTV_No internet service | -0.227578 |
| StreamingTV_Yes | 0.063254 |
| StreamingMovies_No internet service | -0.227578 |
| StreamingMovies_Yes | 0.060860 |
| Contract_One year | -0.178225 |
| Contract_Two year | -0.301552 |
| PaperlessBilling_Yes | 0.191454 |
| PaymentMethod_Credit card (automatic | -0.134687 |
| PaymentMethod_Electronic check | 0.301455 |
| PaymentMethod_Mailed check | -0.090773 |
| Churn_Yes | 1.000000 |
| Name: Churn_Yes, dtype: float64 |
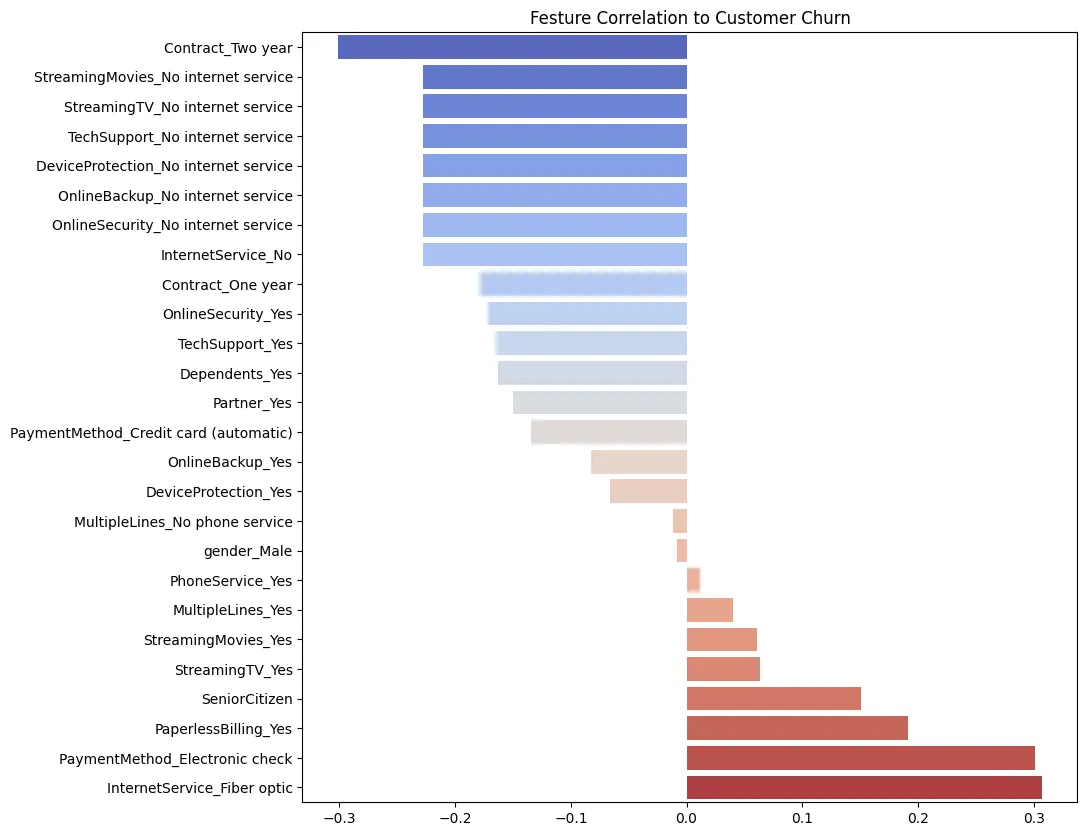
# create correlation dataframe
telco_df_numeric_corr = telco_df_numeric.corr(numeric_only=True)['Churn_Yes'][:-2].sort_values()
plt.figure(figsize=(10, 10))
plt.title('Festure Correlation to Customer Churn')

sns.barplot(
    y=telco_df_numeric_corr.index,
    x=telco_df_numeric_corr.values,
    estimator='mean',
    errorbar=None,
    palette='coolwarm',
    orient='h'
)

plt.savefig('assets/telco-customer-churn_05.webp', bbox_inches='tight')
Churn Analaysis
# segmenting customers based on their tenure
telco_df['Contract'].value_counts()

# Month-to-month    3875
# Two year          1685
# One year          1472
# Name: Contract, dtype: int64
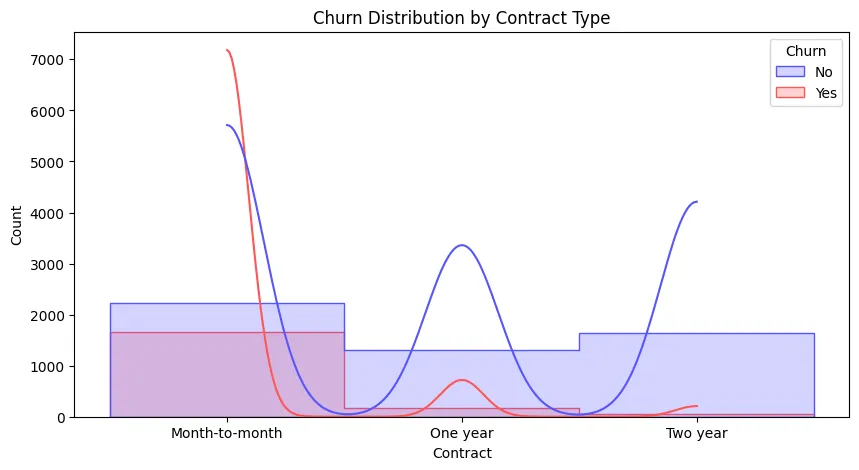
plt.figure(figsize=(10, 5))
plt.title('Churn Distribution by Contract Type')

sns.histplot(
    data=telco_df,
    x='Contract',
    hue='Churn',
    element='step',
    palette='seismic',
    kde=True
)

plt.savefig('assets/telco-customer-churn_06.webp', bbox_inches='tight')
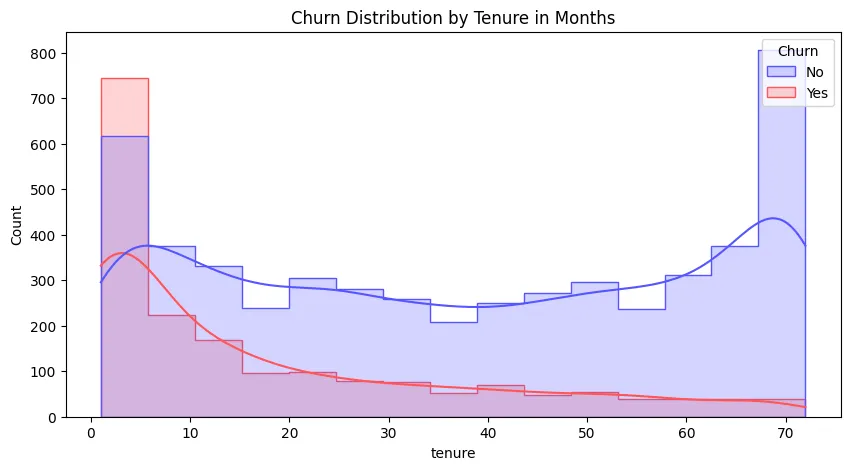
plt.figure(figsize=(10, 5))
plt.title('Churn Distribution by Tenure in Months')

sns.histplot(
    data=telco_df,
    x='tenure',
    hue='Churn',
    element='step',
    palette='seismic',
    kde=True
)

plt.savefig('assets/telco-customer-churn_07.webp', bbox_inches='tight')
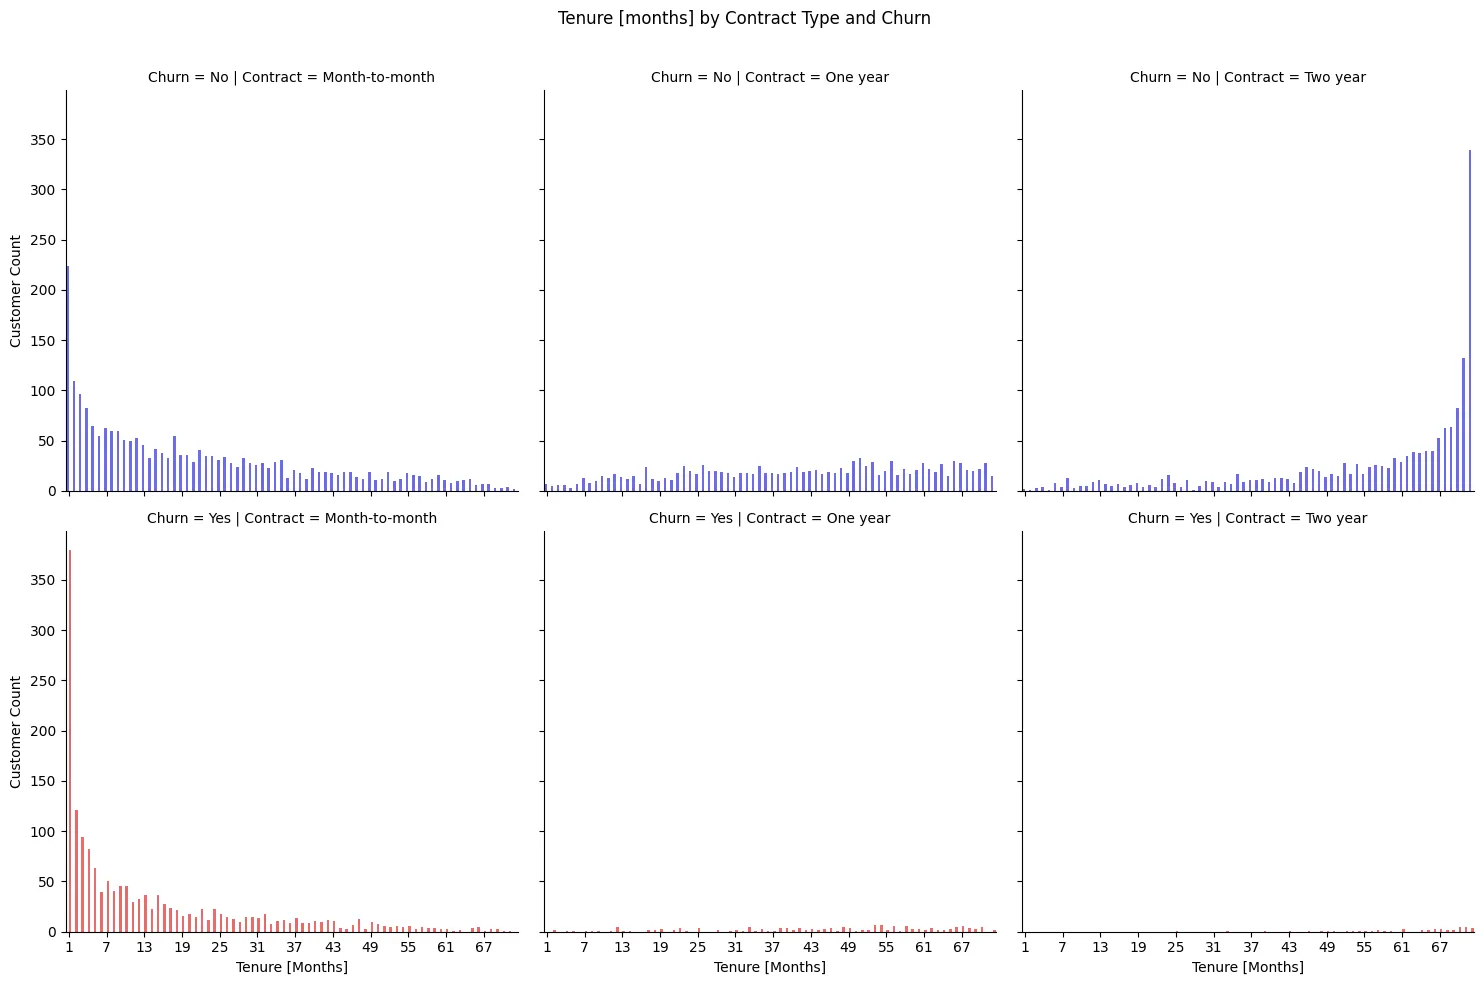
grid = sns.catplot(
    data=telco_df,
    x='tenure',
    kind='count',
    hue='Churn',
    palette='seismic',
    col='Contract',
    row='Churn'
)

grid.set(
    xticks=np.arange(0,72,6),
    xlabel='Tenure [Months]',
    ylabel='Customer Count'
)

grid.fig.subplots_adjust(top=0.9)
grid.fig.suptitle('Tenure [months] by Contract Type and Churn')

plt.savefig('assets/telco-customer-churn_08.webp', bbox_inches='tight')
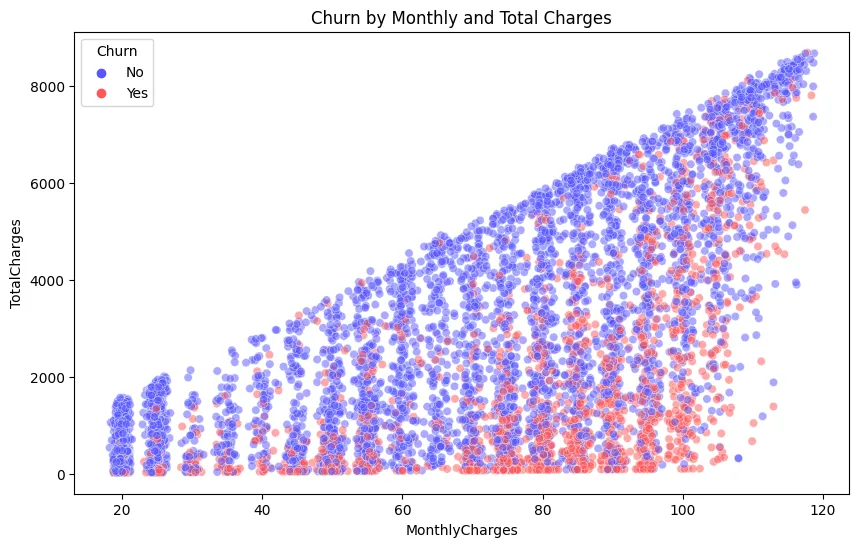
plt.figure(figsize=(10, 6))

plot = sns.scatterplot(
    x='MonthlyCharges',
    y='TotalCharges',
    data=telco_df,
    hue='Churn',
    palette='seismic',
    alpha=0.5
)

plot.set_title('Churn by Monthly and Total Charges')

plt.savefig('assets/telco-customer-churn_09.webp', bbox_inches='tight')
Tenure Cohort Study
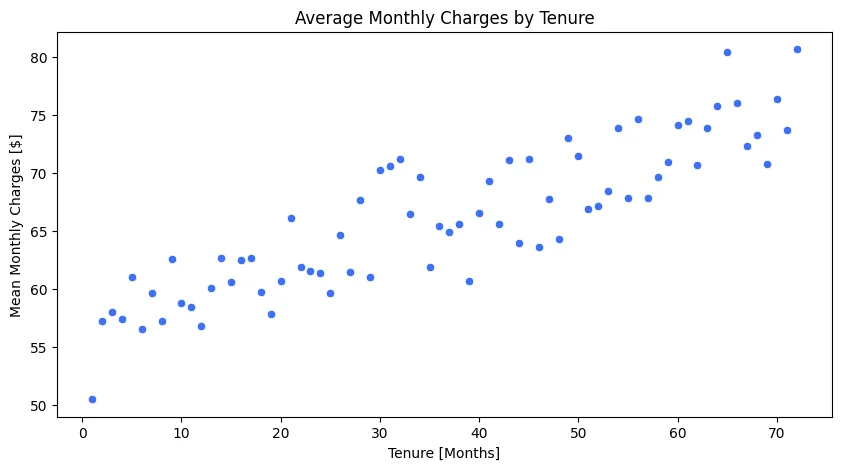
# group customers by tenure and calculate average monthly charges
telco_df_tenure = telco_df.groupby('tenure').mean(numeric_only=True)['MonthlyCharges']
| tenure | MonthlyCharges |
|---|---|
| 1 | 50.485808 |
| 2 | 57.206303 |
| 3 | 58.015000 |
| 4 | 57.432670 |
| 5 | 61.003759 |
| ... | |
| 68 | 73.321000 |
| 69 | 70.823158 |
| 70 | 76.378992 |
| 71 | 73.735588 |
| 72 | 80.695856 |
| Name: MonthlyCharges, Length: 72, dtype: float64 |
plt.figure(figsize=(10, 5))
plt.title('Average Monthly Charges by Tenure')
plt.xlabel('Tenure [Months]')
plt.ylabel('Mean Monthly Charges [$]')

sns.scatterplot(
    x=telco_df_tenure.index,
    y=telco_df_tenure.values,
    color='#3b70f7'
)

plt.savefig('assets/telco-customer-churn_10.webp', bbox_inches='tight')
# adding missing columns
telco_df_numeric['Tenure'] = telco_df['tenure']
telco_df_numeric['Monthly Charges'] = telco_df['MonthlyCharges']
telco_df_numeric['Total Charges'] = telco_df['TotalCharges']
telco_df_numeric['Contract'] = telco_df['Contract']
telco_df_numeric[['Tenure', 'Churn_Yes']]
| Tenure | Churn_Yes | |
|---|---|---|
| 0 | 1 | 0 |
| 1 | 34 | 0 |
| 2 | 2 | 1 |
| 3 | 45 | 0 |
| 4 | 2 | 1 |
| ... | ||
| 7038 | 24 | 0 |
| 7039 | 72 | 0 |
| 7040 | 11 | 0 |
| 7041 | 4 | 1 |
| 7042 | 66 | 0 |
| 7032 rows × 2 columns |
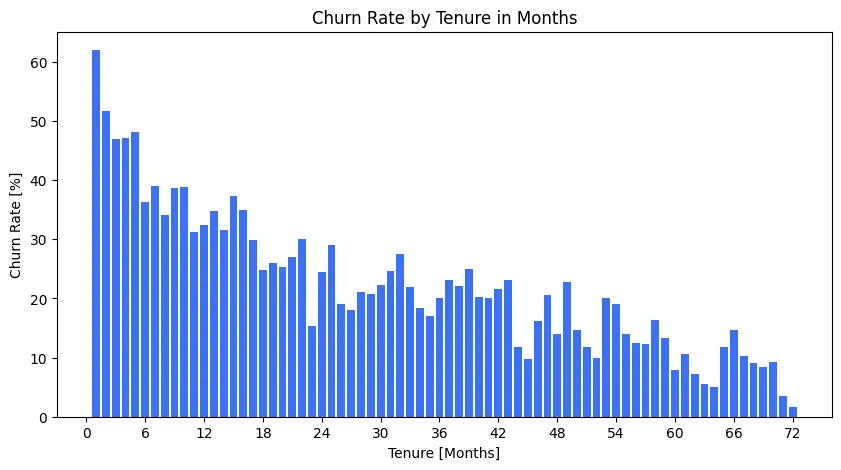
# group customers by tenure and calculate average churn rate
telco_df_tenure_Churn = telco_df_numeric.groupby('Tenure').mean(numeric_only=True)['Churn_Yes']
| Tenure | Average Churn Rate |
|---|---|
| 1 | 0.619902 |
| 2 | 0.516807 |
| 3 | 0.470000 |
| 4 | 0.471591 |
| 5 | 0.481203 |
| ... | |
| 68 | 0.090000 |
| 69 | 0.084211 |
| 70 | 0.092437 |
| 71 | 0.035294 |
| 72 | 0.016575 |
| Name: Churn_Yes, Length: 72, dtype: float64 |
fig, ax = plt.subplots(
    figsize=(10,5)
)
ax.bar(
    x=telco_df_tenure_Churn.index,
    height=telco_df_tenure_Churn.values.round(4)*100,
    color='#3b70f7'
)
ax.set_title('Churn Rate by Tenure in Months')
ax.set(
    xlabel='Tenure [Months]',
    ylabel='Churn Rate [%]',
    xticks=np.arange(0,78,6)
)

fig.savefig('assets/telco-customer-churn_11.webp', bbox_inches='tight')
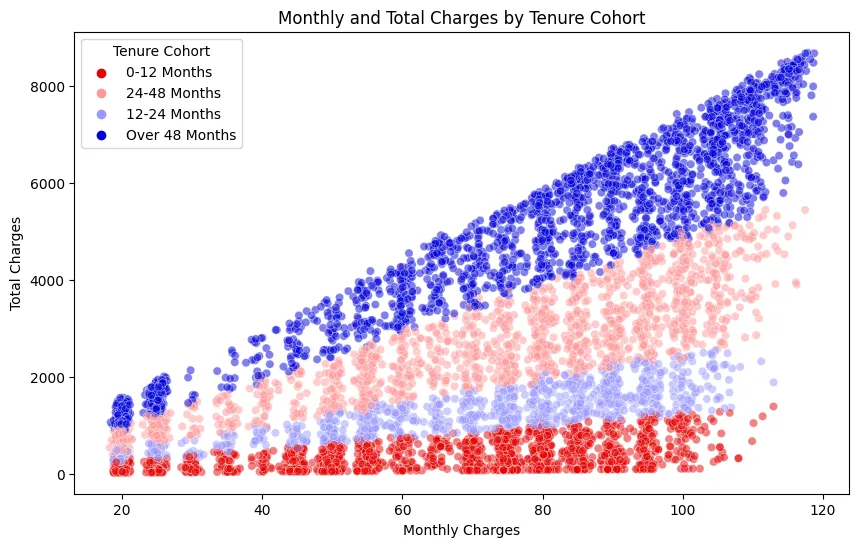
# group customers in chorts 0-12,12-24,24-48 and above 48 months tenure
def tenure_cohort(tenure):
    if tenure < 13:
        return '0-12 Months'
    elif tenure < 25:
        return '12-24 Months'
    elif tenure < 49:
        return '24-48 Months'
    else:
        return 'Over 48 Months'
telco_df_numeric['Tenure Cohort'] = telco_df_numeric['Tenure'].apply(tenure_cohort)
telco_df_numeric[['Tenure','Tenure Cohort']]
| Tenure | Tenure Cohort | |
|---|---|---|
| 0 | 1 | 0-12 Months |
| 1 | 34 | 24-48 Months |
| 2 | 2 | 0-12 Months |
| 3 | 45 | 24-48 Months |
| 4 | 2 | 0-12 Months |
| ... | ||
| 7038 | 24 | 12-24 Months |
| 7039 | 72 | Over 48 Months |
| 7040 | 11 | 0-12 Months |
| 7041 | 4 | 0-12 Months |
| 7042 | 66 | Over 48 Months |
| 7032 rows × 2 columns |
plt.figure(figsize=(10, 6))

plot = sns.scatterplot(
    x='Monthly Charges',
    y='Total Charges',
    data=telco_df_numeric,
    hue='Tenure Cohort',
    palette='seismic_r',
    alpha=0.5
)

plot.set_title('Monthly and Total Charges by Tenure Cohort')

plt.savefig('assets/telco-customer-churn_12.webp', bbox_inches='tight')
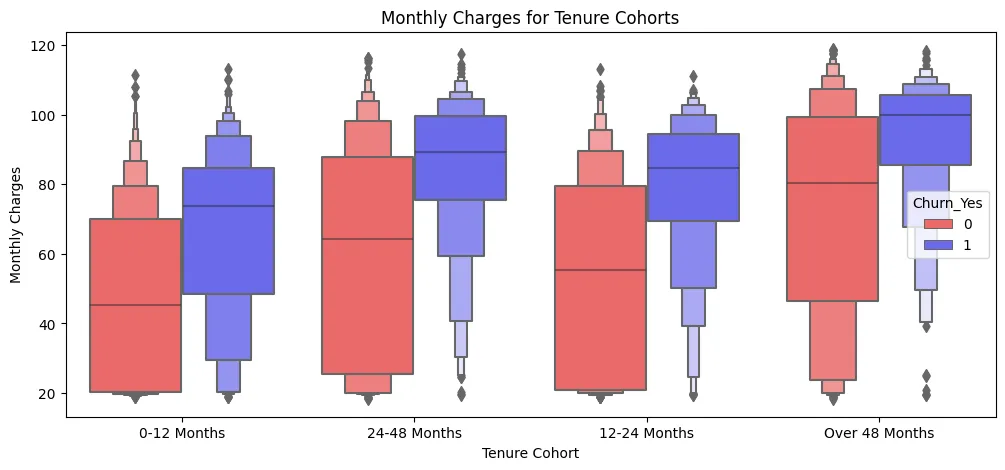
plt.figure(figsize=(12, 5))
plt.title('Monthly Charges for Tenure Cohorts')

sns.boxenplot(
    data=telco_df_numeric,
    x='Tenure Cohort',
    y='Monthly Charges',
    hue='Churn_Yes',
    palette='seismic_r'
)
plt.savefig('assets/telco-customer-churn_13.webp', bbox_inches='tight')
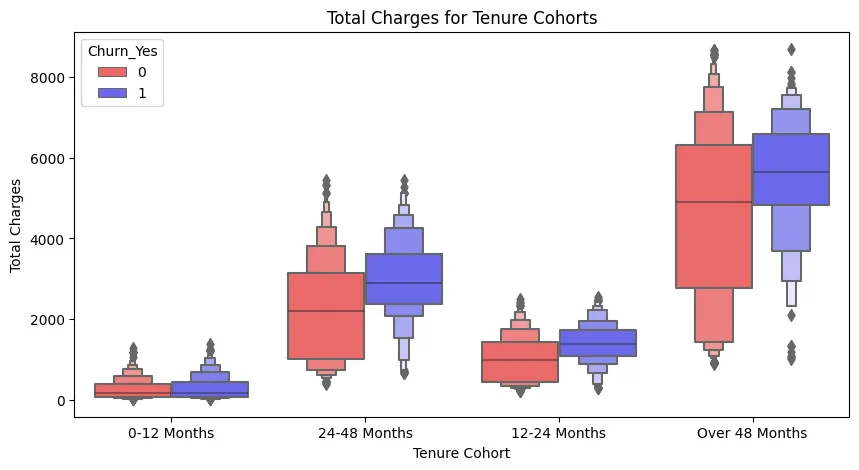
plt.figure(figsize=(10, 5))
plt.title('Total Charges for Tenure Cohorts')

sns.boxenplot(
    data=telco_df_numeric,
    x='Tenure Cohort',
    y='Total Charges',
    hue='Churn_Yes',
    palette='seismic_r'
)
plt.savefig('assets/telco-customer-churn_14.webp', bbox_inches='tight')
plt.figure(figsize=(10, 5))
plt.title('Churn by Tenure Cohorts')

sns.countplot(
    data=telco_df_numeric,
    x='Tenure Cohort',
    hue='Churn_Yes',
    palette='seismic_r'
)
plt.savefig('assets/telco-customer-churn_15.webp', bbox_inches='tight')

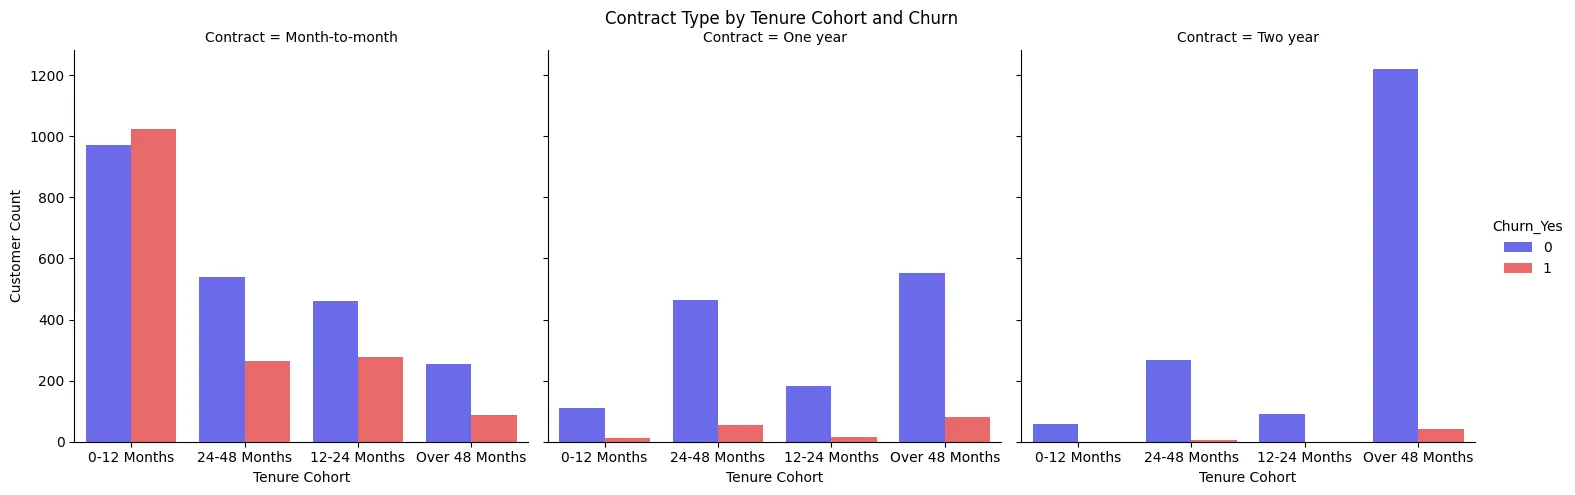
grid = sns.catplot(
    data=telco_df_numeric,
    x='Tenure Cohort',
    kind='count',
    hue='Churn_Yes',
    palette='seismic',
    col='Contract'
)

grid.set(
    # xticks=np.arange(0,72,6),
    xlabel='Tenure Cohort',
    ylabel='Customer Count'
)

grid.fig.subplots_adjust(top=0.9)
grid.fig.suptitle('Contract Type by Tenure Cohort and Churn')

plt.savefig('assets/telco-customer-churn_16.webp', bbox_inches='tight')
Predictive Modeling
Single Decision Tree
Baseline single tree classifier with default hyper parameters.
# remove target feature and non-numeric columns from training set
X_churn = telco_df_numeric.drop(['Churn_Yes','Tenure Cohort', 'Contract'], axis=1)
y_churn = telco_df_numeric['Churn_Yes']
# train/test split
X_churn_train, X_churn_test, y_churn_train, y_churn_test = train_test_split(
    X_churn,
    y_churn,
    test_size=0.2
)
# fit the model
tree_classifier = DecisionTreeClassifier()
tree_classifier.fit(X_churn_train, y_churn_train)
# run predictions
y_tree_preds = tree_classifier.predict(X_churn_test)
# evaluate predictions
conf_mtx_tree = confusion_matrix(y_churn_test, y_tree_preds)

conf_mtx_tree_plot = ConfusionMatrixDisplay(
    confusion_matrix=conf_mtx_tree,
    display_labels=[False,True]
)

conf_mtx_tree_plot.plot(cmap='winter')

plt.savefig('assets/telco-customer-churn_17.webp', bbox_inches='tight')

report_tree = classification_report(
    y_churn_test, y_tree_preds
)
print(report_tree)
| precision | recall | f1-score | support | |
|---|---|---|---|---|
| 0 | 0.80 | 0.81 | 0.81 | 1012 |
| 1 | 0.51 | 0.50 | 0.50 | 395 |
| accuracy | 0.72 | 1407 | ||
| macro avg | 0.66 | 0.65 | 0.65 | 1407 |
| weighted avg | 0.72 | 0.72 | 0.72 | 1407 |
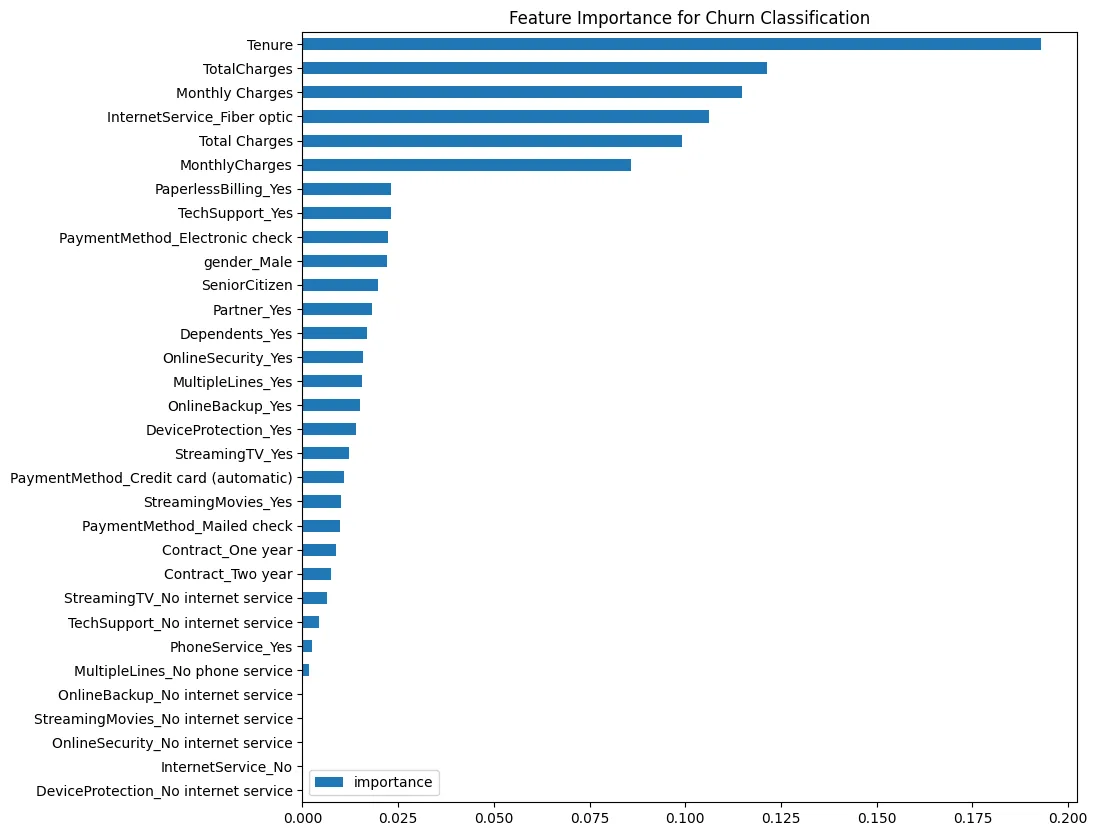
# feature importance for classification
tree_index = ['importance']
tree_data_columns = pd.Series(X_churn.columns)
tree_importance_array = tree_classifier.feature_importances_
tree_importance_df = pd.DataFrame(tree_importance_array, tree_data_columns, tree_index)
tree_importance_df
| importance | |
|---|---|
| SeniorCitizen | 0.019747 |
| gender_Male | 0.022160 |
| Partner_Yes | 0.018070 |
| Dependents_Yes | 0.016844 |
| PhoneService_Yes | 0.002513 |
| MultipleLines_No phone service | 0.001701 |
| MultipleLines_Yes | 0.015637 |
| InternetService_Fiber optic | 0.106278 |
| InternetService_No | 0.000000 |
| OnlineSecurity_No internet service | 0.000000 |
| OnlineSecurity_Yes | 0.015796 |
| OnlineBackup_No internet service | 0.000000 |
| OnlineBackup_Yes | 0.015036 |
| DeviceProtection_No internet service | 0.000000 |
| DeviceProtection_Yes | 0.013911 |
| TechSupport_No internet service | 0.004314 |
| TechSupport_Yes | 0.023056 |
| StreamingTV_No internet service | 0.006463 |
| StreamingTV_Yes | 0.012094 |
| StreamingMovies_No internet service | 0.000000 |
| StreamingMovies_Yes | 0.010126 |
| Contract_One year | 0.008873 |
| Contract_Two year | 0.007519 |
| PaperlessBilling_Yes | 0.023079 |
| PaymentMethod_Credit card (automatic) | 0.010816 |
| PaymentMethod_Electronic check | 0.022332 |
| PaymentMethod_Mailed check | 0.009718 |
| Tenure | 0.192801 |
| MonthlyCharges | 0.085796 |
| TotalCharges | 0.121363 |
| Monthly Charges | 0.114721 |
| Total Charges | 0.099236 |
tree_importance_df.sort_values(
    by='importance',
    ascending=True
).plot(
    kind='barh',
    title='Feature Importance for Churn Classification',
    figsize=(10,10)
)

plt.savefig('assets/telco-customer-churn_18.webp', bbox_inches='tight')
Random Forest
Random forest with grid search for optimal hyper parameter.
rdnfor_classifier = RandomForestClassifier()

param_grid = {
    'n_estimators': [5, 25, 50, 75,100, 125],
    'min_samples_split': [1,2,3],
    'min_samples_leaf': [1,2,3],
    'criterion': ['gini', 'entropy', 'log_loss'],
    'max_features' : ['sqrt', 'log2']
}

grid_search_rdnfor = GridSearchCV(
    estimator = rdnfor_classifier,
    param_grid = param_grid
)

grid_search_rdnfor.fit(X_churn_train, y_churn_train)
print('Best Parameter: ', grid_search_rdnfor.best_params_)
# Best Parameter:  {'criterion': 'gini', 'max_features': 'log2', 'min_samples_leaf': 3, 'min_samples_split': 2, 'n_estimators': 125}
# run predictions
y_rdnfor_preds = grid_search_rdnfor.predict(X_churn_test)
# evaluate predictions
conf_mtx_rdnfor = confusion_matrix(y_churn_test, y_rdnfor_preds)

conf_mtx_rdnfor_plot = ConfusionMatrixDisplay(
    confusion_matrix=conf_mtx_rdnfor,
    display_labels=[False,True]
)

conf_mtx_rdnfor_plot.plot(cmap='winter')

plt.savefig('assets/telco-customer-churn_19.webp', bbox_inches='tight')

report_rdnfor = classification_report(
    y_churn_test, y_rdnfor_preds
)
print(report_rdnfor)
| precision | recall | f1-score | support | |
|---|---|---|---|---|
| 0 | 0.84 | 0.91 | 0.87 | 1012 |
| 1 | 0.70 | 0.55 | 0.61 | 395 |
| accuracy | 0.81 | 1407 | ||
| macro avg | 0.77 | 0.73 | 0.74 | 1407 |
| weighted avg | 0.80 | 0.81 | 0.80 | 1407 |
Adaptive Boosting
Baseline AdaBoost classifier with default hyper parameters.
abc_classifier = AdaBoostClassifier(
    estimator=None,
    n_estimators=50,
    learning_rate=1.0
)

abc_classifier.fit(X_churn_train, y_churn_train)

abc_classifier_preds = abc_classifier.predict(X_churn_test)
# run predictions
y_abc_preds = abc_classifier.predict(X_churn_test)
# evaluate predictions
conf_mtx_abc = confusion_matrix(y_churn_test, y_abc_preds)

conf_mtx_abc_plot = ConfusionMatrixDisplay(
    confusion_matrix=conf_mtx_abc,
    display_labels=[False,True]
)

conf_mtx_abc_plot.plot(cmap='winter')

plt.savefig('assets/telco-customer-churn_21.webp', bbox_inches='tight')

report_abc = classification_report(
    y_churn_test, y_abc_preds
)
print(report_abc)
| precision | recall | f1-score | support | |
|---|---|---|---|---|
| 0 | 0.85 | 0.91 | 0.88 | 1012 |
| 1 | 0.72 | 0.58 | 0.64 | 395 |
| accuracy | 0.82 | 1407 | ||
| macro avg | 0.78 | 0.75 | 0.76 | 1407 |
| weighted avg | 0.81 | 0.82 | 0.81 | 1407 |
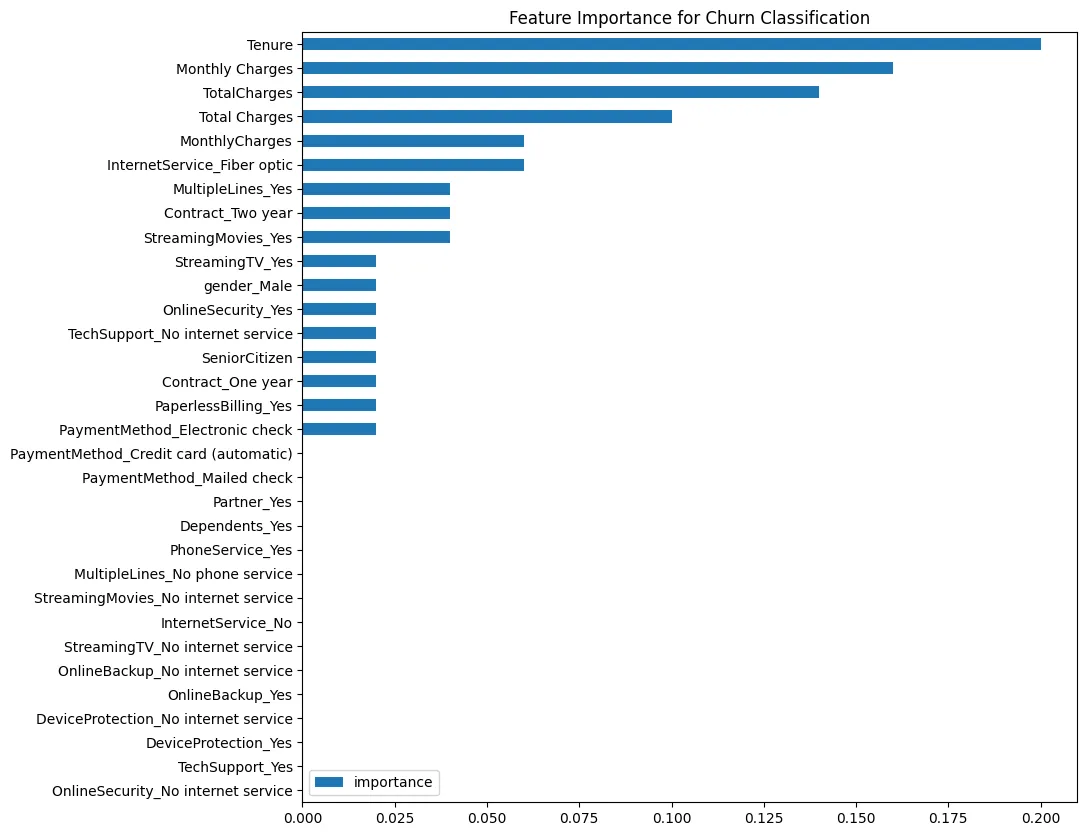
# feature importance for classification
abc_index = ['importance']
abc_data_columns = pd.Series(X_churn.columns)
abc_importance_array = abc_classifier.feature_importances_
abc_importance_df = pd.DataFrame(abc_importance_array, abc_data_columns, abc_index)
abc_importance_df
abc_importance_df.sort_values(
    by='importance',
    ascending=True
).plot(
    kind='barh',
    title='Feature Importance for Churn Classification',
    figsize=(10,10)
)

plt.savefig('assets/telco-customer-churn_22.webp', bbox_inches='tight')
Gradient Boosting
GradientBoost Classifier with grid search for optimal hyper parameter.
gb_classifier = GradientBoostingClassifier()
param_grid = {
    'n_estimators': [50, 100, 150],
    'learning_rate': [0.05,0.1,0.2],
    'max_depth': [2,3,4,5]
}
grid_search_gb = GridSearchCV(gb_classifier, param_grid)
grid_search_gb.fit(X_churn_train, y_churn_train)
grid_search_gb.best_params_
# {'learning_rate': 0.1, 'max_depth': 3, 'n_estimators': 100}
# run predictions
y_gb_preds = grid_search_gb.predict(X_churn_test)
# evaluate predictions
conf_mtx_gb = confusion_matrix(y_churn_test, y_gb_preds)

conf_mtx_gb_plot = ConfusionMatrixDisplay(
    confusion_matrix=conf_mtx_gb,
    display_labels=[False,True]
)

conf_mtx_gb_plot.plot(cmap='winter')

plt.savefig('assets/telco-customer-churn_23.webp', bbox_inches='tight')

report_gb = classification_report(
    y_churn_test, y_gb_preds
)
print(report_gb)
| precision | recall | f1-score | support | |
|---|---|---|---|---|
| 0 | 0.84 | 0.92 | 0.88 | 1012 |
| 1 | 0.73 | 0.56 | 0.63 | 395 |
| accuracy | 0.82 | 1407 | ||
| macro avg | 0.79 | 0.74 | 0.75 | 1407 |
| weighted avg | 0.81 | 0.82 | 0.81 | 1407 |
Support Vector Classifier
# normalize feature values
sc_churn = StandardScaler()
X_churn_train_scaled=sc_churn.fit_transform(X_churn_train)
X_churn_test_scaled=sc_churn.transform(X_churn_test)
# SVM classifier fitting
svc_classifier = svm.SVC()
svc_classifier.fit(X_churn_train_scaled, y_churn_train)
# Predictions
y_svc_pred = svc_classifier.predict(X_churn_test_scaled)
# evaluate predictions
conf_mtx_svc = confusion_matrix(y_churn_test, y_svc_pred)

conf_mtx_svc_plot = ConfusionMatrixDisplay(
    confusion_matrix=conf_mtx_svc,
    display_labels=[False,True]
)

conf_mtx_svc_plot.plot(cmap='winter')

plt.savefig('assets/telco-customer-churn_24.webp', bbox_inches='tight')

report_svc = classification_report(
    y_churn_test, y_svc_pred
)
print(report_svc)
| precision | recall | f1-score | support | |
|---|---|---|---|---|
| 0 | 0.83 | 0.92 | 0.87 | 1012 |
| 1 | 0.72 | 0.50 | 0.59 | 395 |
| accuracy | 0.81 | 1407 | ||
| macro avg | 0.77 | 0.71 | 0.73 | 1407 |
| weighted avg | 0.80 | 0.81 | 0.79 | 1407 |