Logstash 7 Digesting Webserver Logs

Setup Elasticsearch
Before I was using an existing ELK Cluster and it is working well in production. But I have difficulties connecting to it through CURL (I am using Kibana to manage it so I never noticed):
curl localhost:9200

curl: (7) Failed to connect to localhost port 9200: Connection refused
So I now set up a fresh version of the Elasticsearch Docker Container :
docker pull elasticsearch:7.13.4
docker pull logstash:7.13.4
docker pull kibana:7.13.4
docker run -d \
       --name elasticsearch \
       --privileged \
       --net=host\
       -e "discovery.type=single-node" \
       -e "XPACK_SECURITY_ENABLED=false" \
       -e "XPACK_REPORTING_ENABLED=false" \
       -e "XPACK_MONITORING_ENABLED=false" \
       elasticsearch:7.13.4
And tada! Now - without all the virtual network trickery - it works:
curl localhost:9200

{
  "name" : "Debian11",
  "cluster_name" : "docker-cluster",
  "cluster_uuid" : "3Gi_d-bqT06e3qJwNai6hw",
  "version" : {
    "number" : "7.13.4",
    "build_flavor" : "default",
    "build_type" : "docker",
    "build_hash" : "c5f60e894ca0c61cdbae4f5a686d9f08bcefc942",
    "build_date" : "2021-07-14T18:33:36.673943207Z",
    "build_snapshot" : false,
    "lucene_version" : "8.8.2",
    "minimum_wire_compatibility_version" : "6.8.0",
    "minimum_index_compatibility_version" : "6.0.0-beta1"
  },
  "tagline" : "You Know, for Search"
}
To make sure my installation is save (without any security settings) I will close the door to the outside world:
ufw deny 9200/tcp

Rule updated
Rule updated (v6)

ufw deny 9300/tcp

Rule updated
Rule updated (v6)
Use CURL to Upload and Query Data
Before I was using a dataset that was too big to be used in Kibana and had to be broken up. The Data that is available for download here. Just download the mapping and data to your server:
curl http://media.sundog-soft.com/es7/shakes-mapping.json >> shakespeare_mapping.json
curl http://media.sundog-soft.com/es7/shakespeare_7.0.json >> shakespeare.json
We can now use CURL against the Elasticsearch REST API to create our Shakespeare index:
curl -H "Content-Type: application/json" -XPUT 127.0.0.1:9200/shakespeare --data-binary @shakespeare_mapping.json

{"acknowledged":true,"shards_acknowledged":true,"index":"shakespeare"}
curl -H "Content-Type: application/json" -XPOST 127.0.0.1:9200/shakespeare/_bulk --data-binary @shakespeare.json

{"acknowledged":true,"shards_acknowledged":true,"index":"shakespeare"}
We can now query the index:
curl -H "Content-Type: application/json" -XGET '127.0.0.1:9200/shakespeare/_search?pretty' -d '{"query": {"match_phrase": {"text_entry": "Juliet is the sun."}}}'
And get the response:
{
  "took" : 35,
  "timed_out" : false,
  "_shards" : {
    "total" : 1,
    "successful" : 1,
    "skipped" : 0,
    "failed" : 0
  },
  "hits" : {
    "total" : {
      "value" : 1,
      "relation" : "eq"
    },
    "max_score" : 16.28321,
    "hits" : [
      {
        "_index" : "shakespeare",
        "_type" : "_doc",
        "_id" : "86136",
        "_score" : 16.28321,
        "_source" : {
          "type" : "line",
          "line_id" : 86137,
          "play_name" : "Romeo and Juliet",
          "speech_number" : 1,
          "line_number" : "2.2.3",
          "speaker" : "ROMEO",
          "text_entry" : "It is the east, and Juliet is the sun."
        }
      }
    ]
  }
}
Setup Logstash
Preparing the Configuration Files
Before we start the Logstash container we first have to add two configuration files. Start by creating the following directories:
mkdir -p /opt/logstash/pipeline
We can download some Apache log sample data from here:
curl http://media.sundog-soft.com/es/access_log >> /opt/logstash/access_log
It is essential to place your pipeline configuration where it can be found by Logstash. By default, the container will look in /usr/share/logstash/pipeline/ for pipeline configuration files. If you don’t provide configuration to Logstash, it will run with a minimal config that listens for messages from the Beats input plugin and echoes any that are received to stdout.
nano /opt/logstash/pipeline/logstash.conf
input {
  file {
    path => "/usr/share/logstash/access_log"
    start_position => "beginning"
  }
}

filter {
  grok {
    match => {"message" => "%{COMBINEDAPACHELOG}"}
  }
  date {
    match => ["timestamp", "dd/MMM/yyyy:HH:mm:ss Z"]
  }
}

output {
  elasticsearch {
    hosts => ["http://localhost:9200"]
    }
    stdout {
      codec => rubydebug
    }
}
Now we can run the countainer while mounting our configuration file + sample log data:
Bind-mounted configuration files will retain the same permissions and ownership within the container that they have on the host system. Be sure to set permissions such that the files will be readable and, ideally, not writeable by the container’s logstash user (UID 1000).
chown -R 1000:1000 /opt/logstash
docker run \
   --name logstash \
   --net=host \
   --rm -it \
   -v /opt/logstash/pipeline/logstash.conf:/usr/share/logstash/pipeline/logstash.conf \
   -v /opt/logstash/access_log:/usr/share/logstash/access_log \
   -e "ELASTIC_HOST=localhost:9200" \
   -e "XPACK_SECURITY_ENABLED=false" \
   -e "XPACK_REPORTING_ENABLED=false" \
   -e "XPACK_MONITORING_ENABLED=false" \
   -e "XPACK_MONITORING_ELASTICSEARCH_USERNAME=elastic" \
   -e "XPACK_MONITORING_ELASTICSEARCH_PASSWORD=changeme" \
   logstash:7.13.4
This is the point where I abandoned my meek virtual online server. Every time I tried starting Logstash, Elasticsearch ran out of memory and crashed. So I continue on my local Intel NUC (equivalent) that brings the power to handle this setup.
Once I rebuild my setup here I was able to start Logstash and see that it started working on the Apache Log:
2021/07/28 11:53:58 Setting 'xpack.monitoring.enabled' from environment.
2021/07/28 11:53:58 Setting 'xpack.monitoring.elasticsearch.username' from environment.
2021/07/28 11:53:58 Setting 'xpack.monitoring.elasticsearch.password' from environment.
Using bundled JDK: /usr/share/logstash/jdk
OpenJDK 64-Bit Server VM warning: Option UseConcMarkSweepGC was deprecated in version 9.0 and will likely be removed in a future release.
Sending Logstash logs to /usr/share/logstash/logs which is now configured via log4j2.properties
[2021-07-28T11:54:14,361][INFO ][logstash.runner          ] Log4j configuration path used is: /usr/share/logstash/config/log4j2.properties
[2021-07-28T11:54:14,370][INFO ][logstash.runner          ] Starting Logstash {"logstash.version"=>"7.13.4", "jruby.version"=>"jruby 9.2.16.0 (2.5.7) 2021-03-03 f82228dc32 OpenJDK 64-Bit Server VM 11.0.11+9 on 11.0.11+9 +indy +jit [linux-x86_64]"}
[2021-07-28T11:54:14,391][INFO ][logstash.setting.writabledirectory] Creating directory {:setting=>"path.queue", :path=>"/usr/share/logstash/data/queue"}
[2021-07-28T11:54:14,403][INFO ][logstash.setting.writabledirectory] Creating directory {:setting=>"path.dead_letter_queue", :path=>"/usr/share/logstash/data/dead_letter_queue"}
[2021-07-28T11:54:14,722][INFO ][logstash.agent           ] No persistent UUID file found. Generating new UUID {:uuid=>"b0829cb5-dc99-4b99-a2f2-8b5d0f6acfcb", :path=>"/usr/share/logstash/data/uuid"}
[2021-07-28T11:54:15,418][INFO ][logstash.agent           ] Successfully started Logstash API endpoint {:port=>9600}
[2021-07-28T11:54:16,074][INFO ][org.reflections.Reflections] Reflections took 39 ms to scan 1 urls, producing 24 keys and 48 values
[2021-07-28T11:54:17,018][WARN ][deprecation.logstash.outputs.elasticsearch] Relying on default value of `pipeline.ecs_compatibility`, which may change in a future major release of Logstash. To avoid unexpected changes when upgrading Logstash, please explicitly declare your desired ECS Compatibility mode.
[2021-07-28T11:54:17,223][INFO ][logstash.outputs.elasticsearch][main] New Elasticsearch output {:class=>"LogStash::Outputs::ElasticSearch", :hosts=>["http://localhost:9200"]}
[2021-07-28T11:54:17,573][INFO ][logstash.outputs.elasticsearch][main] Elasticsearch pool URLs updated {:changes=>{:removed=>[], :added=>[http://localhost:9200/]}}
[2021-07-28T11:54:17,729][WARN ][logstash.outputs.elasticsearch][main] Restored connection to ES instance {:url=>"http://localhost:9200/"}
[2021-07-28T11:54:17,795][INFO ][logstash.outputs.elasticsearch][main] Elasticsearch version determined (7.13.4) {:es_version=>7}
[2021-07-28T11:54:17,797][WARN ][logstash.outputs.elasticsearch][main] Detected a 6.x and above cluster: the `type` event field won't be used to determine the document _type {:es_version=>7}
[2021-07-28T11:54:17,898][WARN ][logstash.outputs.elasticsearch][main] Configuration is data stream compliant but due backwards compatibility Logstash 7.x will not assume writing to a data-stream, default behavior will change on Logstash 8.0 (set `data_stream => true/false` to disable this warning)
[2021-07-28T11:54:17,899][WARN ][logstash.outputs.elasticsearch][main] Configuration is data stream compliant but due backwards compatibility Logstash 7.x will not assume writing to a data-stream, default behavior will change on Logstash 8.0 (set `data_stream => true/false` to disable this warning)
[2021-07-28T11:54:17,917][WARN ][deprecation.logstash.filters.grok][main] Relying on default value of `pipeline.ecs_compatibility`, which may change in a future major release of Logstash. To avoid unexpected changes when upgrading Logstash, please explicitly declare your desired ECS Compatibility mode.
[2021-07-28T11:54:17,966][INFO ][logstash.outputs.elasticsearch][main] Using a default mapping template {:es_version=>7, :ecs_compatibility=>:disabled}
[2021-07-28T11:54:18,082][INFO ][logstash.outputs.elasticsearch][main] Installing Elasticsearch template {:name=>"logstash"}
[2021-07-28T11:54:18,179][INFO ][logstash.javapipeline    ][main] Starting pipeline {:pipeline_id=>"main", "pipeline.workers"=>4, "pipeline.batch.size"=>125, "pipeline.batch.delay"=>50, "pipeline.max_inflight"=>500, "pipeline.sources"=>["/usr/share/logstash/pipeline/logstash.conf"], :thread=>"#<Thread:0x5dc1d77c run>"}[2021-07-28T11:54:18,431][INFO ][logstash.outputs.elasticsearch][main] Created rollover alias {:name=>"<logstash-{now/d}-000001>"}
[2021-07-28T11:54:18,467][INFO ][logstash.outputs.elasticsearch][main] Installing ILM policy {"policy"=>{"phases"=>{"hot"=>{"actions"=>{"rollover"=>{"max_size"=>"50gb", "max_age"=>"30d"}}}}}} {:name=>"logstash-policy"}
[2021-07-28T11:54:19,417][INFO ][logstash.javapipeline    ][main] Pipeline Java execution initialization time {"seconds"=>1.23}
[2021-07-28T11:54:19,619][INFO ][logstash.inputs.file     ][main] No sincedb_path set, generating one based on the "path" setting {:sincedb_path=>"/usr/share/logstash/data/plugins/inputs/file/.sincedb_3c3582877a316ab29d93318b4e2f134b", :path=>["/usr/share/logstash/access_log"]}
[2021-07-28T11:54:19,640][INFO ][logstash.javapipeline    ][main] Pipeline started {"pipeline.id"=>"main"}
[2021-07-28T11:54:19,699][INFO ][filewatch.observingtail  ][main][d3d6ab5c59cc3016c39f3dda745d68e612eae8fca705ae266565c45069b70e27] START, creating Discoverer, Watch with file and sincedb collections
[2021-07-28T11:54:19,706][INFO ][logstash.agent           ] Pipelines running {:count=>1, :running_pipelines=>[:main], :non_running_pipelines=>[]}
{
       "response" => "200",
           "host" => "debian11",
          "ident" => "-",
           "auth" => "-",
    "httpversion" => "1.1",
      "timestamp" => "30/Apr/2017:04:28:11 +0000",
       "referrer" => "\"-\"",
       "@version" => "1",
     "@timestamp" => 2017-04-30T04:28:11.000Z,
          "agent" => "\"Mozilla/5.0 (compatible; DotBot/1.1; http://www.opensiteexplorer.org/dotbot, help@moz.com)\"",
       "clientip" => "216.244.66.246",
           "path" => "/usr/share/logstash/access_log",
           "verb" => "GET",
        "request" => "/docs/triton/pages.html",
        "message" => "216.244.66.246 - - [30/Apr/2017:04:28:11 +0000] \"GET /docs/triton/pages.html HTTP/1.1\" 200 5639 \"-\" \"Mozilla/5.0 (compatible; DotBot/1.1; http://www.opensiteexplorer.org/dotbot, help@moz.com)\"",
          "bytes" => "5639"
}
{
       "response" => "200",
           "host" => "debian11",
          "ident" => "-",
           "auth" => "-",
    "httpversion" => "1.1",
      "timestamp" => "30/Apr/2017:04:30:31 +0000",
       "referrer" => "\"-\"",
       "@version" => "1",
     "@timestamp" => 2017-04-30T04:30:31.000Z,
          "agent" => "\"Mozilla/5.0 (compatible; AhrefsBot/5.2; +http://ahrefs.com/robot/)\"",
       "clientip" => "217.182.132.36",
           "path" => "/usr/share/logstash/access_log",
           "verb" => "GET",
        "request" => "/2012/08/sundog-software-featured-in-august-2012-issue-of-develop/",
        "message" => "217.182.132.36 - - [30/Apr/2017:04:30:31 +0000] \"GET /2012/08/sundog-software-featured-in-august-2012-issue-of-develop/ HTTP/1.1\" 200 14326 \"-\" \"Mozilla/5.0 (compatible; AhrefsBot/5.2; +http://ahrefs.com/robot/)\"",
          "bytes" => "14326"
}


...
Fantastic! And checking Elasticsearch I am able to see that the Logstash index was successfully generated:
curl 'localhost:9200/_cat/indices?v'

health status index                      uuid                   pri rep docs.count docs.deleted store.size pri.store.size
yellow open   logstash-2021.07.28-000001 7jZ-amZEQZCKqNxk8wFPGA   1   1     102972            0     28.1mb         28.1mb
yellow open   shakespeare                xkrzXAdeSWKmYiEUUA4N7g   1   1     111396            0     18.9mb         18.9mb
The index was generated and we are able to search it:
curl -XGET 'localhost:9200/logstash-2021.07.28-000001/_search?pretty'
{
  "took" : 22,
  "timed_out" : false,
  "_shards" : {
    "total" : 1,
    "successful" : 1,
    "skipped" : 0,
    "failed" : 0
  },
  "hits" : {
    "total" : {
      "value" : 10000,
      "relation" : "gte"
    },
    "max_score" : 1.0,
    "hits" : [
      {
        "_index" : "logstash-2021.07.28-000001",
        "_type" : "_doc",
        "_id" : "q_b37HoBWtrhasx0jqIE",
        "_score" : 1.0,
        "_source" : {
          "response" : "200",
          "host" : "debian11",
          "ident" : "-",
          "auth" : "-",
          "httpversion" : "1.1",
          "timestamp" : "02/May/2017:03:41:24 +0000",
          "referrer" : "\"http://sundog-soft.com/wp-cron.php?doing_wp_cron=1493696484.8063950538635253906250\"",
          "@version" : "1",
          "@timestamp" : "2017-05-02T03:41:24.000Z",
          "agent" : "\"WordPress/4.7.4; http://sundog-soft.com\"",
          "clientip" : "54.210.20.202",
          "path" : "/usr/share/logstash/access_log",
          "verb" : "POST",
          "request" : "/wp-cron.php?doing_wp_cron=1493696484.8063950538635253906250",
          "message" : "54.210.20.202 - - [02/May/2017:03:41:24 +0000] \"POST /wp-cron.php?doing_wp_cron=1493696484.8063950538635253906250 HTTP/1.1\" 200 - \"http://sundog-soft.com/wp-cron.php?doing_wp_cron=1493696484.8063950538635253906250\" \"WordPress/4.7.4; http://sundog-soft.com\""
        }
      },
      {
        "_index" : "logstash-2021.07.28-000001",
        "_type" : "_doc",
        "_id" : "CPb37HoBWtrhasx0jqOZ",
        "_score" : 1.0,
        "_source" : {
          "response" : "301",
          "host" : "debian11",
          "ident" : "-",
          "auth" : "-",
          "httpversion" : "1.1",
          "timestamp" : "02/May/2017:03:47:28 +0000",
          "referrer" : "\"-\"",
          "@version" : "1",
          "@timestamp" : "2017-05-02T03:47:28.000Z",
          "agent" : "\"Mozilla/5.0 (compatible; Baiduspider/2.0; +http://www.baidu.com/search/spider.html)\"",
          "clientip" : "180.76.15.32",
          "path" : "/usr/share/logstash/access_log",
          "verb" : "GET",
          "request" : "/?utm_source=newsletter&utm_medium=email&utm_campaign=triton-151",
          "message" : "180.76.15.32 - - [02/May/2017:03:47:28 +0000] \"GET /?utm_source=newsletter&utm_medium=email&utm_campaign=triton-151 HTTP/1.1\" 301 - \"-\" \"Mozilla/5.0 (compatible; Baiduspider/2.0; +http://www.baidu.com/search/spider.html)\""
        }
      },


      ...
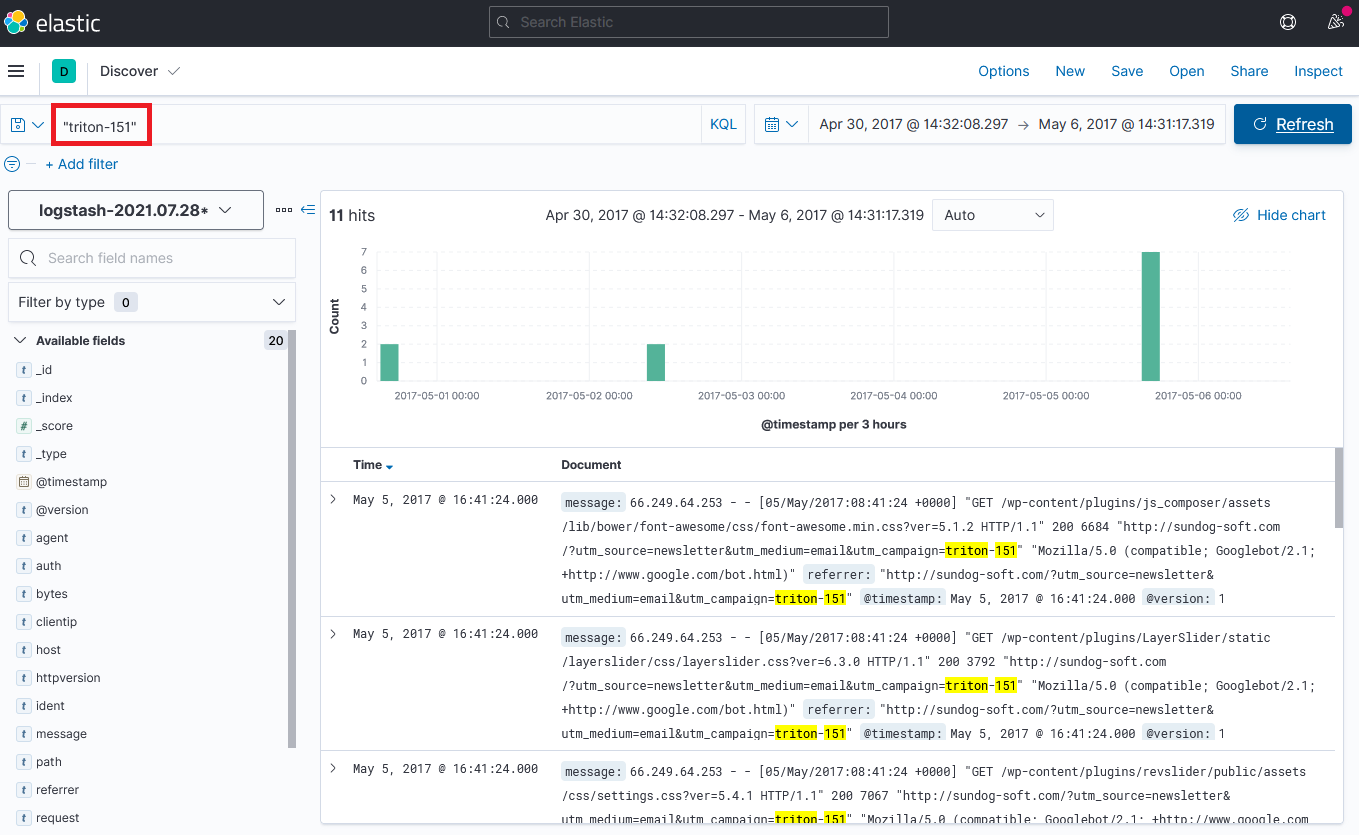
To search for e.g. the responses you got for a certain campaign, run the following POST search query:
curl -u elastic:changeme http://localhost:9200/logstash-2021.07.28-000001/_doc/_search?pretty=true -H 'Content-Type: application/json' -d '{
    "query": {
        "query_string": {"query": "triton-151"}
    }
}'
Setup Kibana
We can now start the Kibana container:
docker run -d \
  --name kibana \
  --net=host \
  -e "ELASTICSEARCH_HOSTS=http://localhost:9200" \
  -e "XPACK_MONITORING_ELASTICSEARCH_USERNAME=elastic" \
  -e "XPACK_MONITORING_ELASTICSEARCH_PASSWORD=changeme" \
  kibana:7.13.4
And create the Index Pattern with timestamp as our primary field:
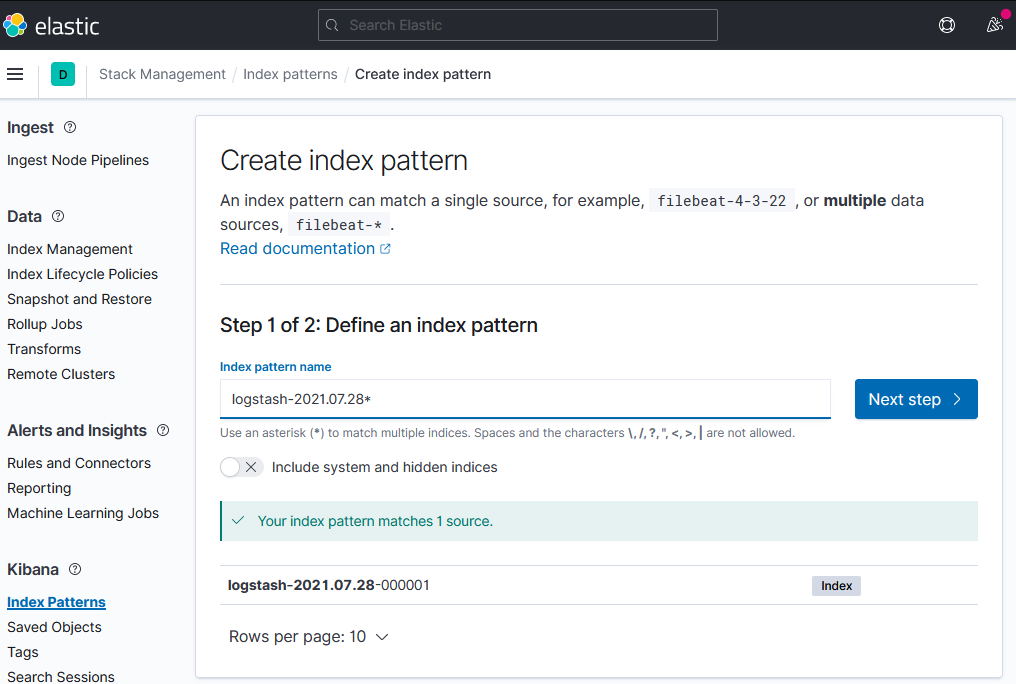
We can now re-run our campaign search query from before and will get nice graphic showing us exactly when those campaign URL's were hit: