Logstash 7 Working with Unstructured Data

Grok Pattern Filter
Introduction
Grok is a great way to parse unstructured log data into something structured and queryable. This tool is perfect for syslog logs, apache and other webserver logs, mysql logs, and in general, any log format that is generally written for humans and not computer consumption. Logstash ships with about 120 patterns by default. You can find them here.
As an example we already used the Grok filter to help us ingest an Apache access log earlier:
filter {
  grok {
    match => {"body" => "%{COMBINEDAPACHELOG}"}
  }
  date {
    match => ["timestamp", "dd/MMM/yyyy:HH:mm:ss Z"]
  }
}
If you have an unstructured log that contains client email addresses you can use the following Grok pattern to extract them:
%{EMAILADDRESS:client_email}
We can also combine pattern to match our logfile - for example:
2021-08-02T04:54:17.043+02:00 DEBUG An event happened
Can be analyzed with the following pattern:
%{TIMESTAMP_ISO8601:time} %{LOGLEVEL:level} %{GREEDYDATA:body}
Debugging Grok Pattern
You can generate those patterns using the Grok Debugger which comes with a very helpful auto-completion function:
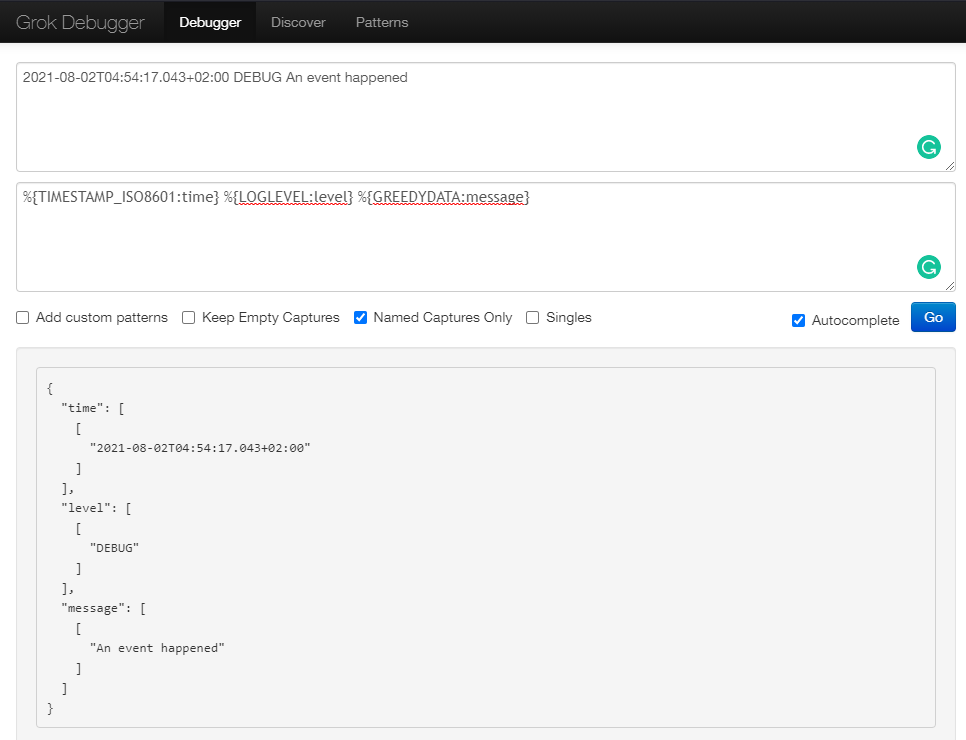
The Grok filter fulfils it's duty and brings structure to our log date:
{
  "time": [
    [
      "2021-08-02T04:54:17.043+02:00"
    ]
  ],
  "level": [
    [
      "DEBUG"
    ]
  ],
  "body": [
    [
      "An event happened"
    ]
  ]
}
Analyzing a Logfile
We now have a pattern that fits our log. Let's apply it to:
/opt/logstash/grok_test
2021-08-01T09:39:44Z INFO variable server value is connector
2021-06-21T22:23:12Z ERROR cannot find the requested resource
2021-05-14T14:52:36Z INFO variable server value is connector
2021-03-26T01:22:56Z DEBUG initializing checksum
2021-02-13T13:17:11Z INFO initializing the bootup
The Logstash configuration to use our Grok filter pattern looks like:
/opt/logstash/pipeline/logstash.conf
input {
  file {
    path => "/usr/share/logstash/grok_test"
    start_position => "beginning"
    sincedb_path => "/dev/null"
  }
}
filter {
  grok {
    match => { "message" => ['%{TIMESTAMP_ISO8601:time} %{level:level} %{GREEDYDATA:body}'] }
  }
  mutate {
    remove_field => ["message", "@timestamp", "path", "host", "@version"]
  }
}
output {
   elasticsearch {
     hosts => "http://localhost:9200"
     index => "grok_test"
  }

stdout {}

}
And run Logstash with the new configuration file:
docker run \
   --name logstash \
   --net=host \
   --rm -it \
   -v /opt/logstash/pipeline/logstash.conf:/usr/share/logstash/pipeline/logstash.conf \
   -v /opt/logstash/grok_test:/usr/share/logstash/grok_test \
   -e "ELASTIC_HOST=localhost:9200" \
   -e "XPACK_SECURITY_ENABLED=false" \
   -e "XPACK_REPORTING_ENABLED=false" \
   -e "XPACK_MONITORING_ENABLED=false" \
   -e "XPACK_MONITORING_ELASTICSEARCH_USERNAME=elastic" \
   -e "XPACK_MONITORING_ELASTICSEARCH_PASSWORD=changeme" \
   logstash:7.13.4
And we can see that the ingestion ran nicely:
[2021-08-02T08:22:19,478][INFO ][logstash.agent] Pipelines running {:count=>1, :running_pipelines=>[:main], :non_running_pipelines=>[]}
{
      "level" => "INFO",
    "body" => "variable server value is connector",
       "time" => "2021-05-14T14:52:36Z"
}
{
      "level" => "INFO",
    "body" => "variable server value is connector",
       "time" => "2021-08-01T09:39:44Z"
}
{
      "level" => "INFO",
    "body" => "initializing the bootup",
       "time" => "2021-02-13T13:17:11Z"
}
{
      "level" => "ERROR",
    "body" => "cannot find the requested resource",
       "time" => "2021-06-21T22:23:12Z"
}
{
      "level" => "DEBUG",
    "body" => "initializing checksum",
       "time" => "2021-03-26T01:22:56Z"
}
Using Multiple Pattern
To see how Grok handles issues with our filter pattern we can add some data to our log that does not fit the format:
/opt/logstash/grok_test
2021-08-01T09:39:44Z INFO variable server value is connector
2021-06-21T22:23:12Z ERROR cannot find the requested resource
2021-05-14T14:52:36Z INFO variable server value is connector
2021-03-26T01:22:56Z DEBUG initializing checksum
2021-02-13T13:17:11Z INFO initializing the bootup
116.112.4.48 GET /wp-admin/index.php
First delete the old indexed data:
curl -XDELETE -u elastic:changeme http://localhost:9200/grok_test
And re-run Logtstash with the dame configuration as before:
{
          "time" => "2021-05-14T14:52:36Z",
      "level" => "INFO",
    "body" => "variable server value is connector"
}
{
          "time" => "2021-06-21T22:23:12Z",
      "level" => "ERROR",
    "body" => "cannot find the requested resource"
}
{
    "tags" => [
        [0] "_grokparsefailure"
    ]
}
{
          "time" => "2021-08-01T09:39:44Z",
      "level" => "INFO",
    "body" => "variable server value is connector"
}
{
          "time" => "2021-02-13T13:17:11Z",
      "level" => "INFO",
    "body" => "initializing the bootup"
}
{
          "time" => "2021-03-26T01:22:56Z",
      "level" => "DEBUG",
    "body" => "initializing checksum"
}
We now have a 6th entry that only contains a parse error, as expected. To fix this issue we can add a secondary pattern to our Grok filter. This filter will be used if the first one fails to parse a line in our data:
/opt/logstash/pipeline/logstash.conf
input {
  file {
    path => "/usr/share/logstash/grok_test"
    start_position => "beginning"
    sincedb_path => "/dev/null"
  }
}
filter {
  grok {
    match => { "message" => [
          '%{TIMESTAMP_ISO8601:time} %{LOGLEVEL:level} %{GREEDYDATA:body}',
          '%{IP:clientIP} %{WORD:httpMethod} %{URIPATH:url}'
        ] }
    }
    mutate {
      remove_field => ["message", "@timestamp", "path", "host", "@version"]
    }
  }
output {
   elasticsearch {
     hosts => "http://localhost:9200"
     index => "grok_test"
  }

stdout {}

}
First delete the old indexed data:
curl -XDELETE -u elastic:changeme http://localhost:9200/grok_test
And re-run Logtstash with the same configuration as before:
{
    "level" => "INFO",
     "time" => "2021-05-14T14:52:36Z",
     "body" => "variable server value is connector"
}
{
    "level" => "ERROR",
     "time" => "2021-06-21T22:23:12Z",
     "body" => "cannot find the requested resource"
}
{
           "url" => "/wp-admin/index.php",
      "clientIP" => "116.112.4.48",
    "httpMethod" => "GET"
}
{
    "level" => "INFO",
     "time" => "2021-08-01T09:39:44Z",
     "body" => "variable server value is connector"
}
{
    "level" => "INFO",
     "time" => "2021-02-13T13:17:11Z",
     "body" => "initializing the bootup"
}
{
    "level" => "DEBUG",
     "time" => "2021-03-26T01:22:56Z",
     "body" => "initializing checksum"
}
The last line failed the first pattern and was then ingested using the second option we gave Logstash. It works!