Log all the searches going through Elasticsearch

- Enable logging of all searches
- Inspecting the logs
- Disable logging of all searches
- Logging Indexing Requests
- Working on the Live System
I always wondered why there is no one-button-solution in Kibana to log all searches and indexation requests sent to Elasticsearch in the engine log file. It would be very helpful to see what users are searching for to add new tags:[keywords] to articles that will position the "correct" article more prominent based on the search queries that are used.
Enable logging of all searches
We are going to leverage the slowlog functionality. The slowlog functions logs everything that takes to long to be processed. Since search queries are usually fast they tend not to show up. But we can lower the threshold making sure that they will be recorded. I am working with an index apache-access-log that was created earlier. To change the settings for this index run the following command in Kibana:
PUT apache-access-log/_settings
{
  "index.search.slowlog.threshold.query.trace": "0s",
  "index.search.slowlog.level": "trace"
}
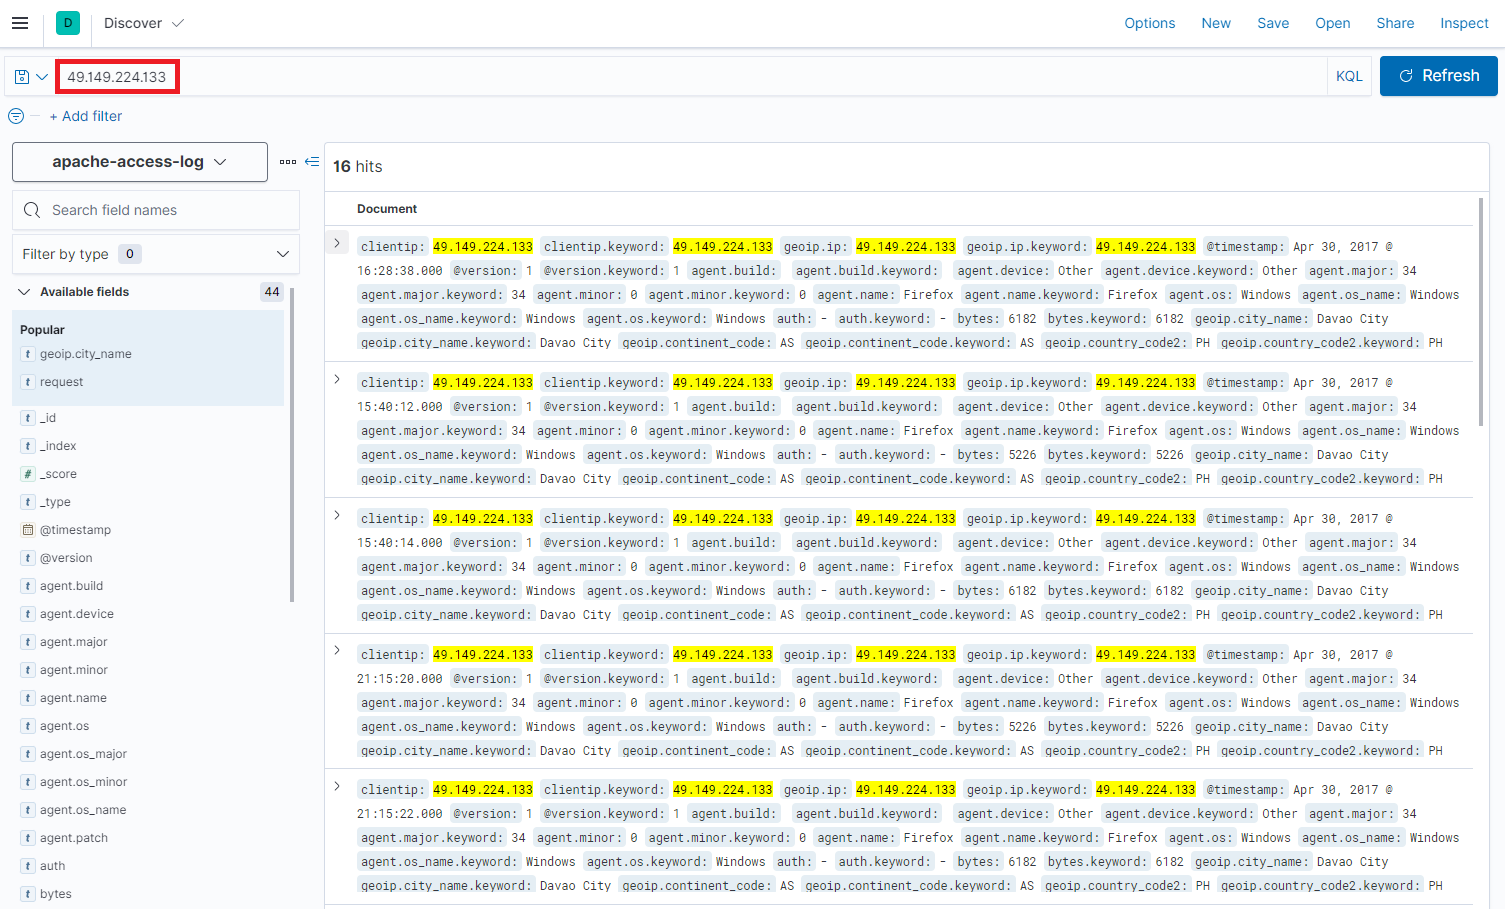
I am running a search query in Kibana for the IP address `49.149.224.133``and get 17 hits:
Inspecting the logs
My Elasticsearch container is running under the name elasticsearch. To check it's logs I need to run the following command:
docker logs elasticsearch
And the log file shows a new entry at the bottom - this is our search query:
{"type": "index_search_slowlog", "timestamp": "2021-08-04T05:37:26,667Z", "level": "TRACE", "component": "i.s.s.query", "cluster.name": "docker-cluster", "node.name": "debian11", "message": "[apache-access-log][0]", "took": "21.5ms", "took_millis": "21", "total_hits": "16 hits", "types": "[]", "stats": "[]", "search_type": "QUERY_THEN_FETCH", "total_shards": "1", "source": "{\"size\":500,\"query\":{\"bool\":{\"filter\":[{\"multi_match\":{\"query\":\"49.149.224.133\",\"fields\":[],\"type\":\"best_fields\",\"operator\":\"OR\",\"slop\":0,\"prefix_length\":0,\"max_expansions\":50,\"lenient\":true,\"zero_terms_query\":\"NONE\",\"auto_generate_synonyms_phrase_query\":true,\"fuzzy_transpositions\":true,\"boost\":1.0}}],\"adjust_pure_negative\":true,\"boost\":1.0}},\"version\":true,\"_source\":false,\"stored_fields\":\"*\",\"fields\":[{\"field\":\"*\",\"include_unmapped\":true},{\"field\":\"@timestamp\",\"format\":\"strict_date_optional_time\"},{\"field\":\"read_timestamp\",\"format\":\"strict_date_optional_time\"}],\"script_fields\":{},\"sort\":[{\"_score\":{\"order\":\"desc\"}}],\"track_total_hits\":2147483647,\"highlight\":{\"pre_tags\":[\"@kibana-highlighted-field@\"],\"post_tags\":[\"@/kibana-highlighted-field@\"],\"fragment_size\":2147483647,\"fields\":{\"*\":{}}}}", "id": "292795eb-82df-4bee-858d-254e4a1192d7", "cluster.uuid": "InACjldtRnu-vUy85P4txw", "node.id": "MsvdkSEdRBmBUftW7CciIw" }
The part we want is inside the source field. As it is JSON inside a JSON it’s escaped, we just need to replace \" by " and we are good to go:
"{"size":500,"query":{"bool":{"filter":[{"multi_match":{"query":"49.149.224.133","fields":[],"type":"best_fields","operator":"OR","slop":0,"prefix_length":0,"max_expansions":50,"lenient":true,"zero_terms_query":"NONE","auto_generate_synonyms_phrase_query":true,"fuzzy_transpositions":true,"boost":1.0}}],"adjust_pure_negative":true,"boost":1.0}},"version":true,"_source":false,"stored_fields":"*","fields":[{"field":"*","include_unmapped":true},{"field":"@timestamp","format":"strict_date_optional_time"},{"field":"read_timestamp","format":"strict_date_optional_time"}],"script_fields":{},"sort":[{"_score":{"order":"desc"}}],"track_total_hits":2147483647,"highlight":{"pre_tags":["@kibana-highlighted-field@"],"post_tags":["@/kibana-highlighted-field@"],"fragment_size":2147483647,"fields":{"*":{}}}}"
I copy the logfile to /opt/logstash/elasticsearch.log and use the following Logstash configuration to ingest the log into Elasticsearch /opt/logstash/pipeline/logstash.conf:
input {
  file {
    path => "/usr/share/logstash/elasticsearch.log"
    start_position => "beginning"
    sincedb_path => "/dev/null"
  }
}
filter {
  json {
      source => "message"
  }
}
output {
   elasticsearch {
     hosts => "http://localhost:9200"
     index => "elasticsearch-log"
  }

stdout {}

}
And run Logstash with the new configuration file:
docker run \
   --name logstash \
   --net=host \
   --rm -it \
   -v /opt/logstash/pipeline/logstash.conf:/usr/share/logstash/pipeline/logstash.conf \
   -v /opt/logstash/elasticsearch.log:/usr/share/logstash/elasticsearch.log \
   -e "ELASTIC_HOST=localhost:9200" \
   -e "XPACK_SECURITY_ENABLED=false" \
   -e "XPACK_REPORTING_ENABLED=false" \
   -e "XPACK_MONITORING_ENABLED=false" \
   -e "XPACK_MONITORING_ELASTICSEARCH_USERNAME=elastic" \
   -e "XPACK_MONITORING_ELASTICSEARCH_PASSWORD=changeme" \
   logstash:7.13.4
This will give me the following result:
{
          "source" => "{\"size\":500,\"query\":{\"bool\":{\"filter\":[{\"multi_match\":{\"query\":\"49.149.224.133\",\"fields\":[],\"type\":\"best_fields\",\"operator\":\"OR\",\"slop\":0,\"prefix_length\":0,\"max_expansions\":50,\"lenient\":true,\"zero_terms_query\":\"NONE\",\"auto_generate_synonyms_phrase_query\":true,\"fuzzy_transpositions\":true,\"boost\":1.0}}],\"adjust_pure_negative\":true,\"boost\":1.0}},\"version\":true,\"_source\":false,\"stored_fields\":\"*\",\"fields\":[{\"field\":\"*\",\"include_unmapped\":true},{\"field\":\"@timestamp\",\"format\":\"strict_date_optional_time\"},{\"field\":\"read_timestamp\",\"format\":\"strict_date_optional_time\"}],\"script_fields\":{},\"sort\":[{\"_score\":{\"order\":\"desc\"}}],\"track_total_hits\":2147483647,\"highlight\":{\"pre_tags\":[\"@kibana-highlighted-field@\"],\"post_tags\":[\"@/kibana-highlighted-field@\"],\"fragment_size\":2147483647,\"fields\":{\"*\":{}}}}",
           "level" => "TRACE",
       "component" => "i.s.s.query",
            "path" => "/usr/share/logstash/elasticsearch.log",
            "type" => "index_search_slowlog",
         "node.id" => "MsvdkSEdRBmBUftW7CciIw",
            "took" => "21.5ms",
      "@timestamp" => 2021-08-04T09:32:57.956Z,
            "host" => "debian11",
       "node.name" => "debian11",
       "timestamp" => "2021-08-04T05:37:26,667Z",
           "types" => "[]",
      "total_hits" => "16 hits",
              "id" => "292795eb-82df-4bee-858d-254e4a1192d7",
         "message" => "[apache-access-log][0]",
    "cluster.uuid" => "InACjldtRnu-vUy85P4txw",
           "stats" => "[]",
        "@version" => "1",
    "total_shards" => "1",
     "search_type" => "QUERY_THEN_FETCH",
     "took_millis" => "21",
    "cluster.name" => "docker-cluster"
}
Now instead of removing all the lines that I don't need explicitly:
mutate {
    remove_field => ["level", "@timestamp", "path", "host", "@version" ...]
  }
I want to use a whitelist to prune everything BUT the source field:
input {
    file {
      path => "/usr/share/logstash/elasticsearch.log"
      start_position => "beginning"
      sincedb_path => "/dev/null"
    }
  }
  filter {
    json {
        source => "message"
    }
    prune {
          interpolate => false
          whitelist_names => ["source"]
    }
    ruby {
      code => "
        # Recursively remove `nil`s and empty objects from event
        def remove_nils!(hash)
          hash.each do |k, v|
            if v.nil?
              hash.delete(k)
            elsif v.is_a?(Hash)
              if v.empty?
                hash.delete(k)
              else
                result = remove_nils!(v)
                if result.empty?
                  hash.delete(k)
                else
                  hash[k] = result
                end
              end
            end
          end
        end
        event_hash = event.to_hash
        event.cancel
        # This one could be improved, stay tuned!
        new_event_block.call(
          LogStash::Event.new(
            remove_nils!(event_hash)
          )
        )
        "
    }
  }
  output {
     elasticsearch {
       hosts => "http://localhost:9200"
       index => "elasticsearch-log"
    }

  stdout {}

  }
To delete the indexed data and re-run run Logstash with the new configuration:
curl -XDELETE -u elastic:changeme http://localhost:9200/elasticsearch-log
Note that "nasty bit" in the configuration named ruby I added because the pruning process left me with a lot of empty {} outputs. I wanted to remove them... but it is not exactly working the way I want. I will have to get back to this later. But the important result is a cleaned up output:
{
      "@version" => "1",
      "@timestamp" => 2021-08-04T10:13:52.032Z,
      "source" => "{\"size\":500,\"query\":{\"bool\":{\"filter\":[{\"multi_match\":{\"query\":\"49.149.224.133\",\"fields\":[],\"type\":\"best_fields\",\"operator\":\"OR\",\"slop\":0,\"prefix_length\":0,\"max_expansions\":50,\"lenient\":true,\"zero_terms_query\":\"NONE\",\"auto_generate_synonyms_phrase_query\":true,\"fuzzy_transpositions\":true,\"boost\":1.0}}],\"adjust_pure_negative\":true,\"boost\":1.0}},\"version\":true,\"_source\":false,\"stored_fields\":\"*\",\"fields\":[{\"field\":\"*\",\"include_unmapped\":true},{\"field\":\"@timestamp\",\"format\":\"strict_date_optional_time\"},{\"field\":\"read_timestamp\",\"format\":\"strict_date_optional_time\"}],\"script_fields\":{},\"sort\":[{\"_score\":{\"order\":\"desc\"}}],\"track_total_hits\":2147483647,\"highlight\":{\"pre_tags\":[\"@kibana-highlighted-field@\"],\"post_tags\":[\"@/kibana-highlighted-field@\"],\"fragment_size\":2147483647,\"fields\":{\"*\":{}}}}"
}
Disable logging of all searches
To go back to the default configuration:
PUT foobar/_settings
{
  "index.search.slowlog.threshold.query.trace": "500ms",
  "index.search.slowlog.level": "info"
}
Logging Indexing Requests
This is less common but we can do the same with the indexing options. Enabling slowlog with full source (warning this can be heavy):
PUT foobar/_settings
{
  "index.indexing.slowlog.threshold.index.trace": "0s",
  "index.indexing.slowlog.level": "trace",
  "index.indexing.slowlog.source": true
}
Getting back to the defaults:
PUT foobar/_settings
{
  "index.indexing.slowlog.threshold.index.trace": "500ms",
  "index.indexing.slowlog.level": "info",
  "index.indexing.slowlog.source": "1000"
}
Working on the Live System
Activate the search query logging
PUT index_2021_06_07/_settings
{
  "index.search.slowlog.threshold.query.trace": "0s",
  "index.search.slowlog.level": "trace"
}
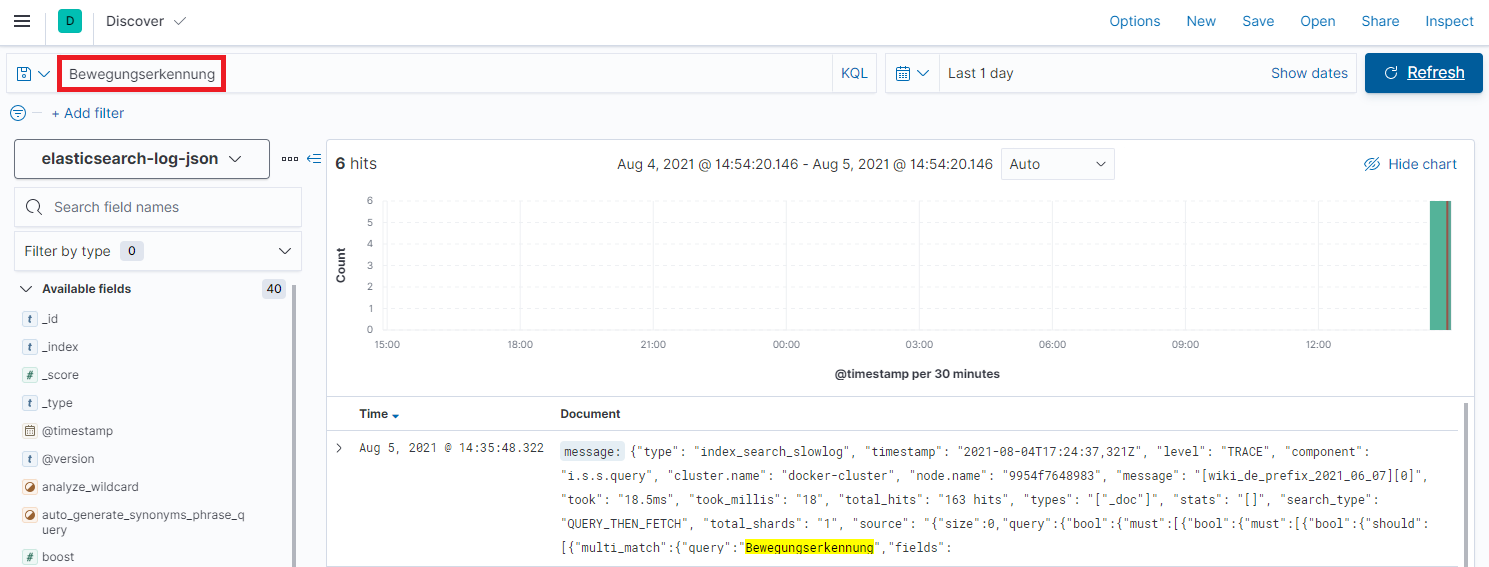
Check that the logging is active
tail -f `docker inspect --format='{{.LogPath}}' elasticsearch_container`
This command (replace the container name with the name of your Elasticsearch container) will print out log entries as they are written to the Elasticsearch logfile. Now run a search from your web frontend - it should show up like this: {"multi_match":{"query": "My Search Query",
{"log":"{\"type\": \"index_search_slowlog\", \"timestamp\": \"2021-08-04T14:02:06,307Z\", \"level\": \"TRACE\", \"component\": \"i.s.s.query\", \"cluster.name\": \"docker-cluster\", \"node.name\": \"9954f7648983\", \"message\": \"[index_2021_06_07][0]\", \"took\": \"1.6ms\", \"took_millis\": \"1\", \"total_hits\": \"272 hits\", \"types\": \"[\\\"_doc\\\"]\", \"stats\": \"[]\", \"search_type\": \"QUERY_THEN_FETCH\", \"total_shards\": \"1\", \"source\": \"{\\\"from\\\":0,\\\"size\\\":5,\\\"query\\\":{\\\"bool\\\":{\\\"must\\\":[{\\\"bool\\\":{\\\"must\\\":[{\\\"bool\\\":{\\\"should\\\":[{\\\"multi_match\\\":{\\\"query\\\":\\\"Port Weiterleitung AVM Fritzbox\\\",\\\"fields\\\":[\\\"abstract^5.0\\\",\\\"description^3.0\\\",\\\"tags^10.0\\\",\\\"title^8.0\\\"],\\\"type\\\":\\\"best_fields\\\",\\\"operator\\\":\\\"OR\\\",\\\"slop\\\":0,\\\"fuzziness\\\":\\\"1\\\",\\\"prefix_length\\\":0,\\\"max_expansions\\\":50,\\\"zero_terms_query\\\":\\\"NONE\\\",\\\"auto_generate_synonyms_phrase_query\\\":true,\\\"fuzzy_transpositions\\\":true,\\\"boost\\\":1.0}},{\\\"multi_match\\\":{\\\"query\\\":\\\"Port Weiterleitung AVM Fritzbox\\\",\\\"fields\\\":[\\\"abstract^5.0\\\",\\\"description^3.0\\\",\\\"tags^10.0\\\",\\\"title^8.0\\\"],\\\"type\\\":\\\"phrase\\\",\\\"operator\\\":\\\"OR\\\",\\\"slop\\\":0,\\\"prefix_length\\\":0,\\\"max_expansions\\\":50,\\\"zero_terms_query\\\":\\\"NONE\\\",\\\"auto_generate_synonyms_phrase_query\\\":true,\\\"fuzzy_transpositions\\\":true,\\\"boost\\\":1.0}}],\\\"adjust_pure_negative\\\":true,\\\"minimum_should_match\\\":\\\"1\\\",\\\"boost\\\":1.0}}],\\\"adjust_pure_negative\\\":true,\\\"boost\\\":1.0}}],\\\"adjust_pure_negative\\\":true,\\\"boost\\\":1.0}},\\\"_source\\\":{\\\"includes\\\":[\\\"*\\\"],\\\"excludes\\\":[]}}\", \"cluster.uuid\": \"1F9RN9roSXqf1sa2Sam7yQ\", \"node.id\": \"bFc0o2JrTBqG0zf9Wydh3g\" }\n","stream":"stdout","time":"2021-08-04T14:02:06.311539637Z"}
Now I am going to check the file location of my ES container log:
docker inspect --format='{{.LogPath}}' elasticsearch_container

/var/lib/docker/containers/9954f76489836bf3def6cc49605f533439431dbcb5e06914eb457055fad54ebf/9954f76489836bf3def6cc49605f533439431dbcb5e06914eb457055fad54ebf-json.log
I copied the file and cleaned it up - removed all those annoying back-slashes! Also removed a few things trying to make the Log valid JSON... but what a mess those logs are! Really not happy with that.
Let's run Logstash with a regular Structured Data / JSON configuration and see what happens:
input {
  file {
    path => "/usr/share/logstash/wiki_elasticseach_2021-08-05.json"
    start_position => "beginning"
    sincedb_path => "/dev/null"
  }
}
filter {
  json {
      source => "message"
  }
}
output {
   elasticsearch {
     hosts => "http://localhost:9200"
     index => "elasticsearch-log-json"
  }

stdout {}

}
docker run \
   --name logstash \
   --net=host \
   --rm -it \
   -v /opt/logstash/pipeline/logstash.conf:/usr/share/logstash/pipeline/logstash.conf \
   -v /opt/logstash/wiki_elasticseach_2021-08-05.json:/usr/share/logstash/wiki_elasticseach_2021-08-05.json \
   -e "ELASTIC_HOST=localhost:9200" \
   -e "XPACK_SECURITY_ENABLED=false" \
   -e "XPACK_REPORTING_ENABLED=false" \
   -e "XPACK_MONITORING_ENABLED=false" \
   -e "XPACK_MONITORING_ELASTICSEARCH_USERNAME=elastic" \
   -e "XPACK_MONITORING_ELASTICSEARCH_PASSWORD=changeme" \
   logstash:7.13.4
To delete the indexed data:
curl -XDELETE -u elastic:changeme http://localhost:9200/elasticsearch-log-json
I found the Docker Log hard to work with. I might try to activate the Elasticsearch SlowLog directly. Currently the ES instance logs to STDOUT and Docker writes it to file. So I end up with two structures wrapped around each other. Also the ES does not separate to different log files this way - everything is just one big blob of broken JSON.