Elasticsearch v8, Filebeat (Docker) and NGINX

Setting Up Elasticsearch & Kibana
I will use the Elasticsearch compose file from here:
version: '3.8'

services:
  elasticsearch:
    container_name: elasticsearch
    restart: always
    build:
      context: elasticsearch/
      args:
        ELK_VERSION: $ELK_VERSION
    volumes:
      - type: bind
        source: ./elasticsearch/config/elasticsearch.yml
        target: /usr/share/elasticsearch/config/elasticsearch.yml
        read_only: true
      - type: volume
        source: elasticsearch
        target: /usr/share/elasticsearch/data
    ports:
      - "9200:9200"
      - "9300:9300"
    environment:
      ES_JAVA_OPTS: '-Xms2g -Xmx2g'
      ELASTIC_PASSWORD: 'changeme'
      discovery.type: single-node
    networks:
      elastic:
        ipv4_address: 172.16.239.102
        aliases:
          - elasticsearch

  kibana:
    container_name: kibana
    restart: unless-stopped
    build:
      context: kibana/
      args:
        ELK_VERSION: $ELK_VERSION
    volumes:
      - type: bind
        source: ./kibana/config/kibana.yml
        target: /usr/share/kibana/config/kibana.yml
        read_only: true
    ports:
      - "5601:5601"
    networks:
      elastic:
        ipv4_address: 172.16.239.104
        aliases:
          - kibana
    depends_on:
      - elasticsearch

networks:
  elastic:
    driver: bridge
    driver_opts:
      com.docker.network.enable_ipv6: "false"
    ipam:
      driver: default
      config:
        - subnet: 172.16.239.0/24

volumes:
  elasticsearch:
Start the service with docker-compose up -d. Elasticsearch will start with the following configuration:
---
## Default Elasticsearch configuration from Elasticsearch base image.
## https://github.com/elastic/elasticsearch/blob/master/distribution/docker/src/docker/config/elasticsearch.yml
#
cluster.name: "docker-cluster"
# network.host: _site_
network.host: 0.0.0.0

## X-Pack settings
## see https://www.elastic.co/guide/en/elasticsearch/reference/current/setup-xpack.html
#
# xpack.license.self_generated.type: trial
xpack.license.self_generated.type: basic
xpack.security.enabled: true
xpack.monitoring.collection.enabled: true
xpack.security.authc:
    anonymous:
      username: anonymous_user
      roles: search_agent
      authz_exception: true

## CORS
http.cors.enabled : true
http.cors.allow-origin: "*"
http.cors.allow-methods: OPTIONS, HEAD, GET, POST, PUT, DELETE
http.cors.allow-credentials: true
http.cors.allow-headers: X-Requested-With, X-Auth-Token, Content-Type, Content-Length, Authorization, Access-Control-Allow-Headers, Accept
Setting up Filebeats
Start by pulling the a fresh version of Filebeat:
docker pull elastic/filebeat:8.0.0
Run the Filebeat Setup
Running Filebeat with the setup command will create the index pattern and load visualizations , dashboards, and machine learning jobs. Run this command:
Note: If you set up Elasticsearch according to this guide, you will have a different
elasticuser password - e.g.ELASTIC_PASSWORD: 'a1hyme+ry1-AltBfpqxY'.
docker run \
-E setup.kibana.host=kibana:5601 \
-E output.elasticsearch.hosts=["elasticsearch:9200"] \
-E output.elasticsearch.username=elastic \
-E output.elasticsearch.password=changeme \
elastic/filebeat:8.0.0
ERROR: This step did not work for me. I keep getting the error message no matches found: output.elasticsearch.hosts=[elasticsearch:9200]. I already added the username and password that were missing in the official documentation. Is this step still necessary in version 8 since the new Datastream tab is automatically populated with the Filebeat data? I am missing the default Filebeat dashboard though - if there is supposed to be one with that name.
UPDATE: You can manually activate the Kibana integration once you started the container - see Add Kibana Dashboard. I don't think this step is still necessary:
I will create a folder:
mkdir -p /opt/beats/config/
and continue working from there.
Configuration
When running Filebeat in a container, you need to provide access to Docker’s unix socket in order for the add_docker_metadata processor to work. You can do this by mounting the socket inside the container. For example:
docker run -v /var/run/docker.sock:/var/run/docker.sock ...
To avoid privilege issues, you may also need to add --user=root to the docker run flags. Because the user must be part of the docker group in order to access /var/run/docker.sock, root access is required if Filebeat is running as non-root inside the container.
If Docker daemon is restarted the mounted socket will become invalid and metadata will stop working, in these situations there are two options:
- Restart Filebeat every time Docker is restarted
- Mount the entire /var/run directory (instead of just the socket)
processors:
  - add_docker_metadata:
      host: "unix:///var/run/docker.sock"
      #match_fields: ["system.process.cgroup.id"]
      #match_pids: ["process.pid", "process.parent.pid"]
      #match_source: true
      #match_source_index: 4
      #match_short_id: true
      #cleanup_timeout: 60
      #labels.dedot: false
      # To connect to Docker over TLS you must specify a client and CA certificate.
      #ssl:
      #  certificate_authority: "/etc/pki/root/ca.pem"
      #  certificate:           "/etc/pki/client/cert.pem"
      #  key:
It has the following settings:
| host | (Optional) Docker socket (UNIX or TCP socket). It uses unix:///var/run/docker.sock by default. |
| ssl | (Optional) SSL configuration to use when connecting to the Docker socket. |
| match_fields | (Optional) A list of fields to match a container ID, at least one of them should hold a container ID to get the event enriched. |
| match_pids | (Optional) A list of fields that contain process IDs. If the process is running in Docker then the event will be enriched. The default value is ["process.pid", "process.parent.pid"]. |
| match_source | (Optional) Match container ID from a log path present in the log.file.path field. Enabled by default. |
| match_short_id | (Optional) Match container short ID from a log path present in the log.file.path field. Disabled by default. This allows to match directories names that have the first 12 characters of the container ID. For example, /var/log/containers/b7e3460e2b21/*.log. |
| match_source_index | (Optional) Index in the source path split by / to look for container ID. It defaults to 4 to match /var/lib/docker/containers/<container_id>/*.log |
| cleanup_timeout | (Optional) Time of inactivity to consider we can clean and forget metadata for a container, 60s by default. |
| labels.dedot | (Optional) Default to be false. If set to true, replace dots in labels with _. |
But I think I am just going to use CLI flags to mount the docker socket as volumes. This simplifies the configuration to:
nano /opt/beats/config/filebeat.yml
filebeat.config:
  modules:
    path: ${path.config}/modules.d/*.yml # enable all modules (nginx, kafka, redis, etc)
    reload.enabled: false

filebeat.autodiscover: # auto-discover tagged docker container
  providers:
    - type: docker
      hints.enabled: true

setup:
  kibana.host: "http://localhost:5601"
  dashboards.enable: true

# processors:
# - add_cloud_metadata: ~ # for AWS, GCO, Azure etc.
# - add_docker_metadata: ~ # add docker metadata (container id, name, image and labels)

output.elasticsearch:
  hosts: 'http://localhost:9200'
  username: 'elastic'
  password: 'changeme'
Note: If you set up Elasticsearch according to this guide, you will have a different
elasticuser password - e.g.ELASTIC_PASSWORD: 'a1hyme+ry1-AltBfpqxY'.
The beat configuration file must belong to the root user and all write permissions for other users must be revoked:
chown root:root /opt/beats/config/filebeat.yml
chmod go-w /opt/beats/config/filebeat.yml
Now we need to bind the location of docker container directory /var/lib/docker/containers and our docker socket /var/run/docker.sock to the container:
docker run -d \
  --name filebeat \
  --user root \
  --net=host \
  -v /opt/beats/config/filebeat.yml:/usr/share/filebeat/filebeat.yml \
  -v /var/lib/docker/containers:/var/lib/docker/containers:ro \
  -v /var/run/docker.sock:/var/run/docker.sock:ro \
  elastic/filebeat:8.0.0
Check if everything started up:
{"log.level":"info","@timestamp":"2022-02-21T04:46:17.294Z","log.origin":{"file.name":"instance/beat.go","file.line":332},"message":"Setup Beat: filebeat; Version: 8.0.0","service.name":"filebeat","ecs.version":"1.6.0"}
{"log.level":"info","@timestamp":"2022-02-21T04:46:17.295Z","log.logger":"esclientleg","log.origin":{"file.name":"eslegclient/connection.go","file.line":105},"message":"elasticsearch url: http://localhost:9200","service.name":"filebeat","ecs.version":"1.6.0"}
{"log.level":"info","@timestamp":"2022-02-21T04:46:17.296Z","log.logger":"publisher","log.origin":{"file.name":"pipeline/module.go","file.line":113},"message":"Beat name: nomad-minion","service.name":"filebeat","ecs.version":"1.6.0"}
{"log.level":"info","@timestamp":"2022-02-21T04:46:17.298Z","log.origin":{"file.name":"fileset/modules.go","file.line":103},"message":"Enabled modules/filesets:  ()","service.name":"filebeat","ecs.version":"1.6.0"}
{"log.level":"info","@timestamp":"2022-02-21T04:46:17.298Z","log.logger":"monitoring","log.origin":{"file.name":"log/log.go","file.line":142},"message":"Starting metrics logging every 30s","service.name":"filebeat","ecs.version":"1.6.0"}
Add Kibana Dashboard
UPDATE: You can already setup the dashboards using the Filebeat config with setup.dashboards.enable: true I added this line to the configuration file above!
To load the recommended index template for writing to Elasticsearch and deploy the sample dashboards for visualizing the data in Kibana, use the command that works with your system.
docker exec -ti filebeat /bin/bash


./filebeat setup --dashboards
Loading dashboards (Kibana must be running and reachable)
Loaded dashboards
The Filebeat Data View is now listed in Kibana:
I can see results come in in Discover:
There are also plenty of Filebeat* Dashboards loaded. But so far no interesting data to fill them with.
Enable and configure data collection modules
Prepare the Filebeat Container
Since we are running Filebeat in Docker, of course this log path does not exist. We have to modify the command that we used to start the Docker container to mount our NGINX logs into the container. The NGINX logs might be found in the /var/log/nginx directory - depending on your NGINX configuration. But I just copied a few logs onto my test system /opt/beats/logs:
-v /opt/beats/logs:/var/log/nginx:ro
And secondly, we need to mount our module configuration file. The template configuration is located inside the Filebeat container under /usr/share/filebeat/modules.d/nginx.yml.disabled:
# Module: nginx
# Docs: https://www.elastic.co/guide/en/beats/filebeat/master/filebeat-module-nginx.html

- module: nginx
  # Access logs
  access:
    enabled: true
    var.paths: ["/var/log/nginx/access.log*"]

  # Error logs
  error:
    enabled: true
    var.paths: [ "/var/log/nginx/error.log*" ]

  # Ingress-nginx controller logs. This is disabled by default. It could be used in Kubernetes environments to parse ingress-nginx logs
  ingress_controller:
    enabled: false

    # Set custom paths for the log files. If left empty,
    # Filebeat will choose the paths depending on your OS.
    #var.paths:
save this file under nginx.yml next to your filebeat.yml and mount it into the modules.d configuration folder - the complete docker command now looks like this:
docker run -d \
  --name filebeat \
  --user root \
  --net=host \
  --restart unless-stopped \
  -v /opt/beats/config/filebeat.yml:/usr/share/filebeat/filebeat.yml \
  -v /opt/beats/config/nginx.yml:/usr/share/filebeat/modules.d/nginx.yml \
  -v /var/lib/docker/containers:/var/lib/docker/containers:ro \
  -v /var/run/docker.sock:/var/run/docker.sock:ro \
  -v /opt/beats/logs:/var/log/nginx:ro \
  elastic/filebeat:8.0.0
Restart the container and verify that the logs and module configuration was actually mounted:
docker exec -ti filebeat /bin/bash

/usr/share/filebeat# ls -la /var/log/nginx/
-rwxrwxrwx 1 root root  9634840 Feb 21 03:47 access.log
-rwxrwxrwx 1 root root    12225 Feb 21 03:47 error.log

ls -la /usr/share/filebeat/modules.d | grep nginx
-rw-r--r-- 1 root root   613 Feb 22 05:54 nginx.yml
-rw-r--r-- 1 root root   788 Feb  3 18:06 nginx.yml.disabled
Check the NGINX Module
- Verify that the NGINX modules was actually enable. To see a list of available modules, run:
docker exec -ti filebeat /bin/bash


/usr/share/filebeat# ./filebeat modules list
Enabled:
nginx

Disabled:
activemq apache auditd aws awsfargate azure barracuda bluecoat cef checkpoint cisco coredns crowdstrike cyberarkpas cylance elasticsearch envoyproxy f5 fortinet gcp google_workspace haproxy ibmmq icinga iis imperva infoblox iptables juniper kafka kibana logstash microsoft misp mongodb mssql mysql mysqlenterprise nats netflow netscout nginx o365 okta oracle osquery panw pensando postgresql proofpoint rabbitmq radware redis santa snort snyk sonicwall sophos squid suricata system threatintel tomcat traefik zeek zookeeper zoom zscaler
To manually activate or deactivate modules run:
./filebeat modules enable nginx
To test your configuration file, change to the directory where the Filebeat binary is installed, and run Filebeat in the foreground with the following options specified:
./filebeat test config -e
Config OK
The documentation I found says that you now should run the setup command to load the available dashboards. I am not sure if this is still necessary since I already did this in the previous step. But running the command returns a Loaded Ingest pipelines - sounds good ~
./filebeat setup -e
Loaded Ingest pipelines
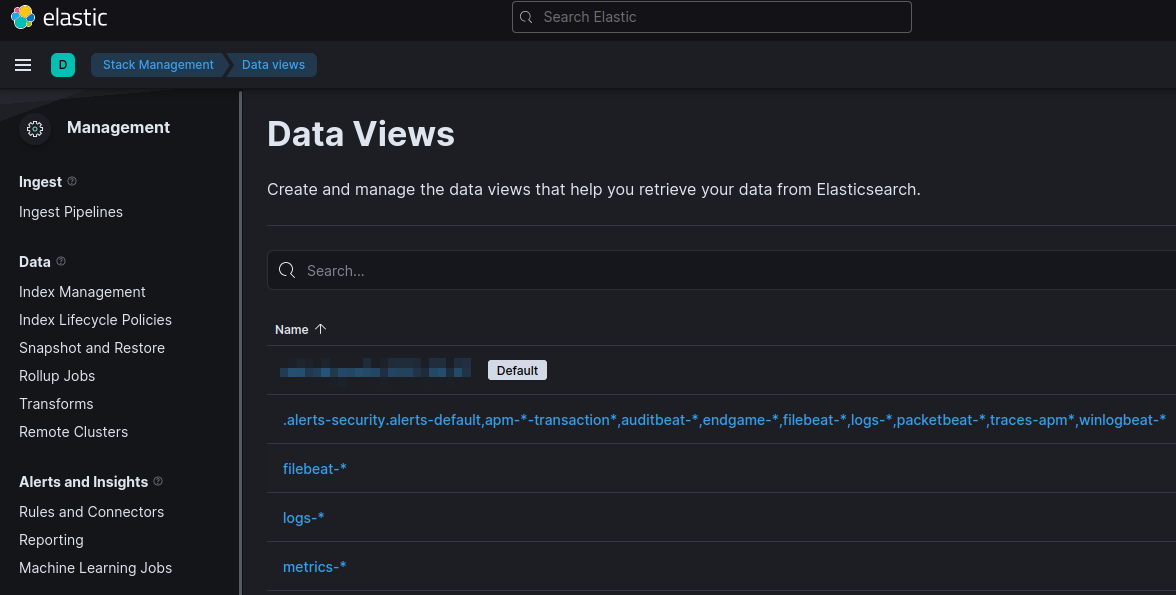
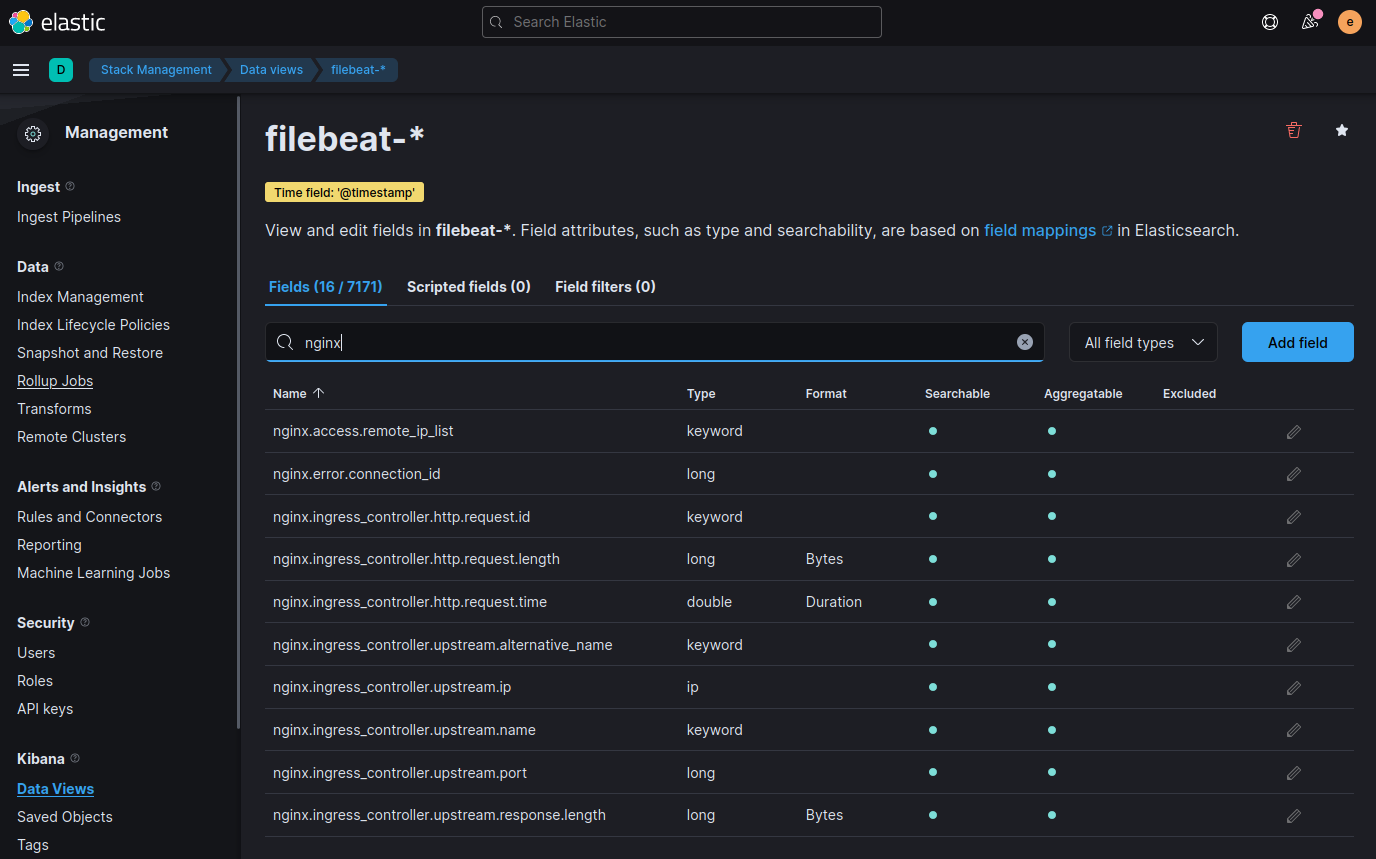
I can see all the NGINX related data points in Data Views:
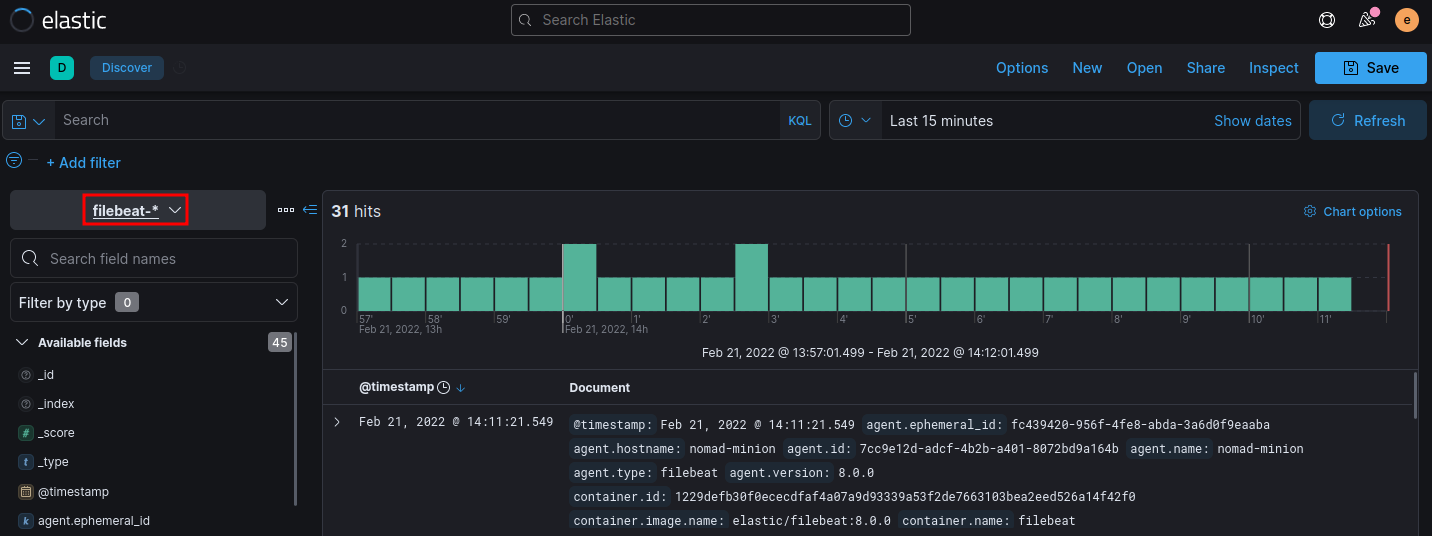
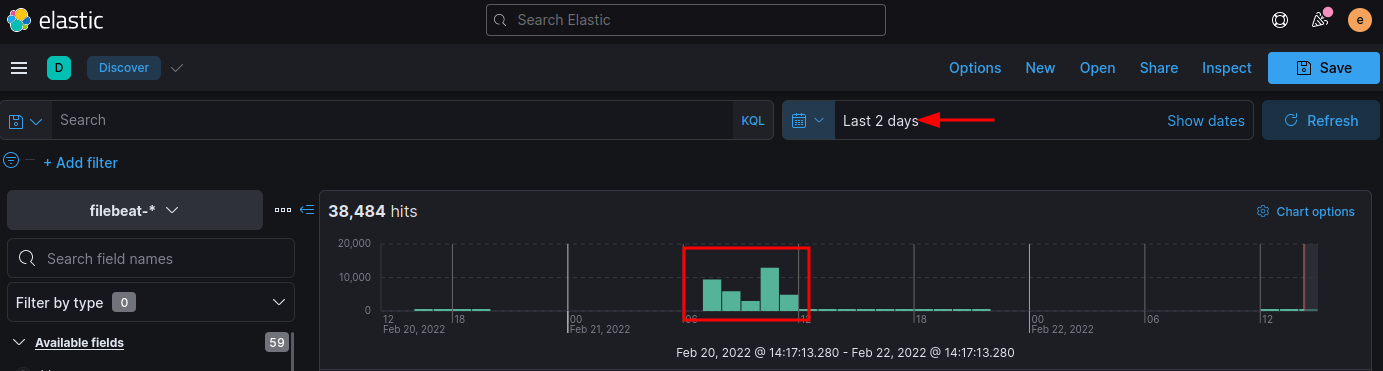
Switching to the Discover I first cannot see anything. But I have to select a time window that matches the date in my logs - by default you only see the last 15 minutes. Drilling in I find my log data from yesterday:
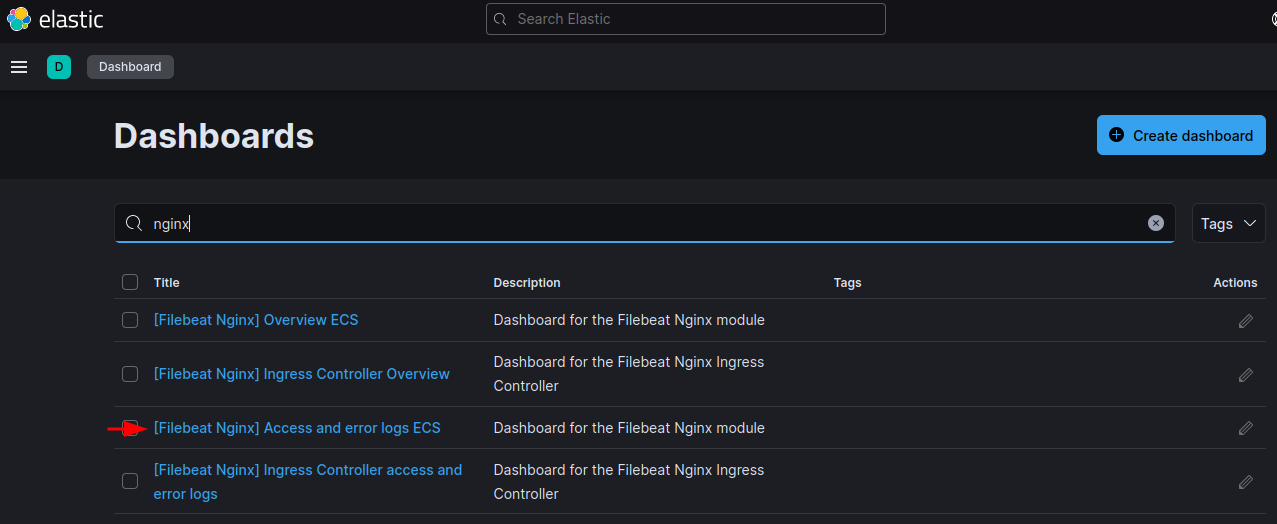
Under Dashboards I now open the NGINX Access & Error Log template:
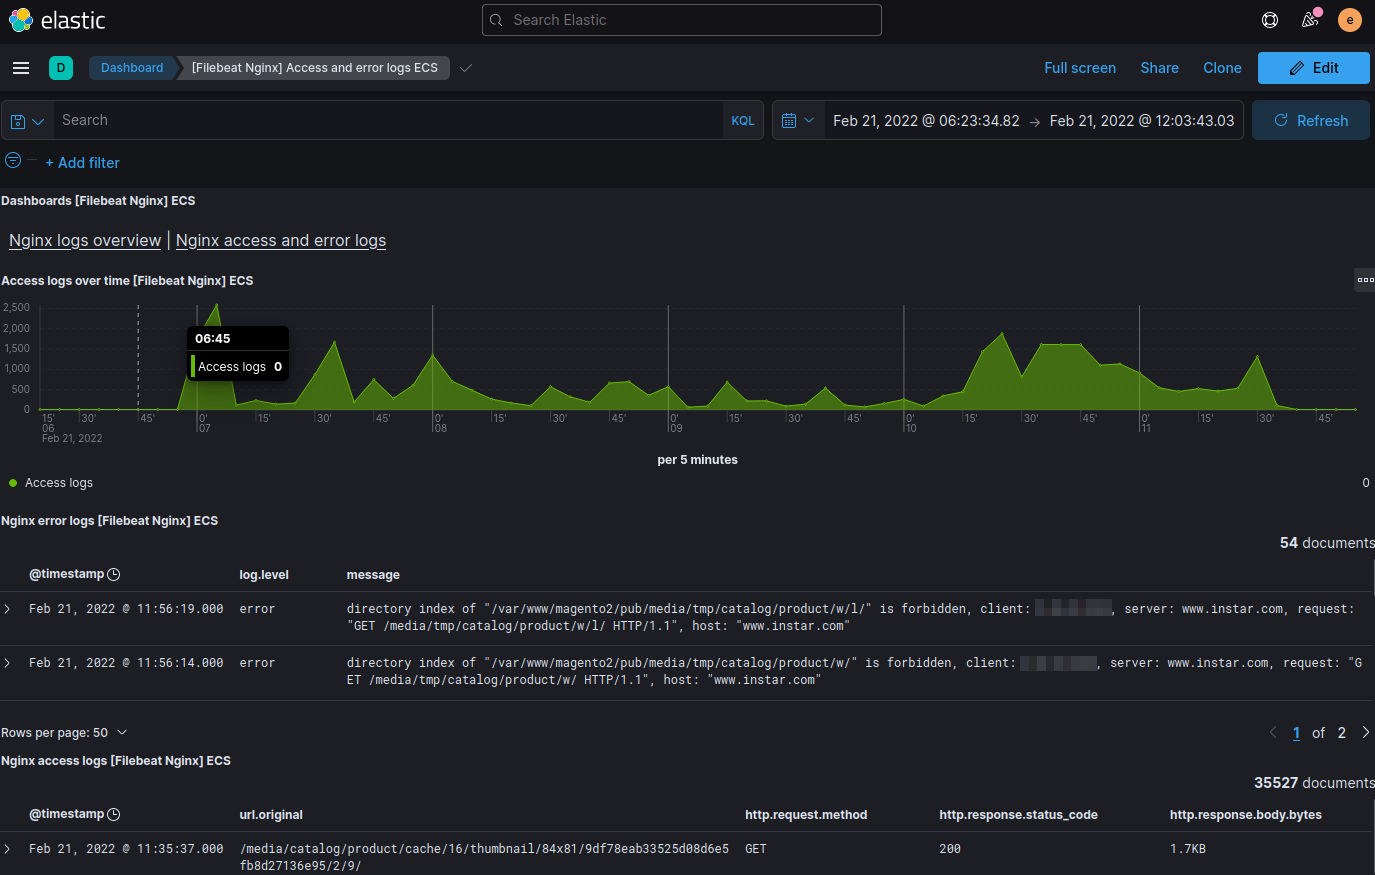
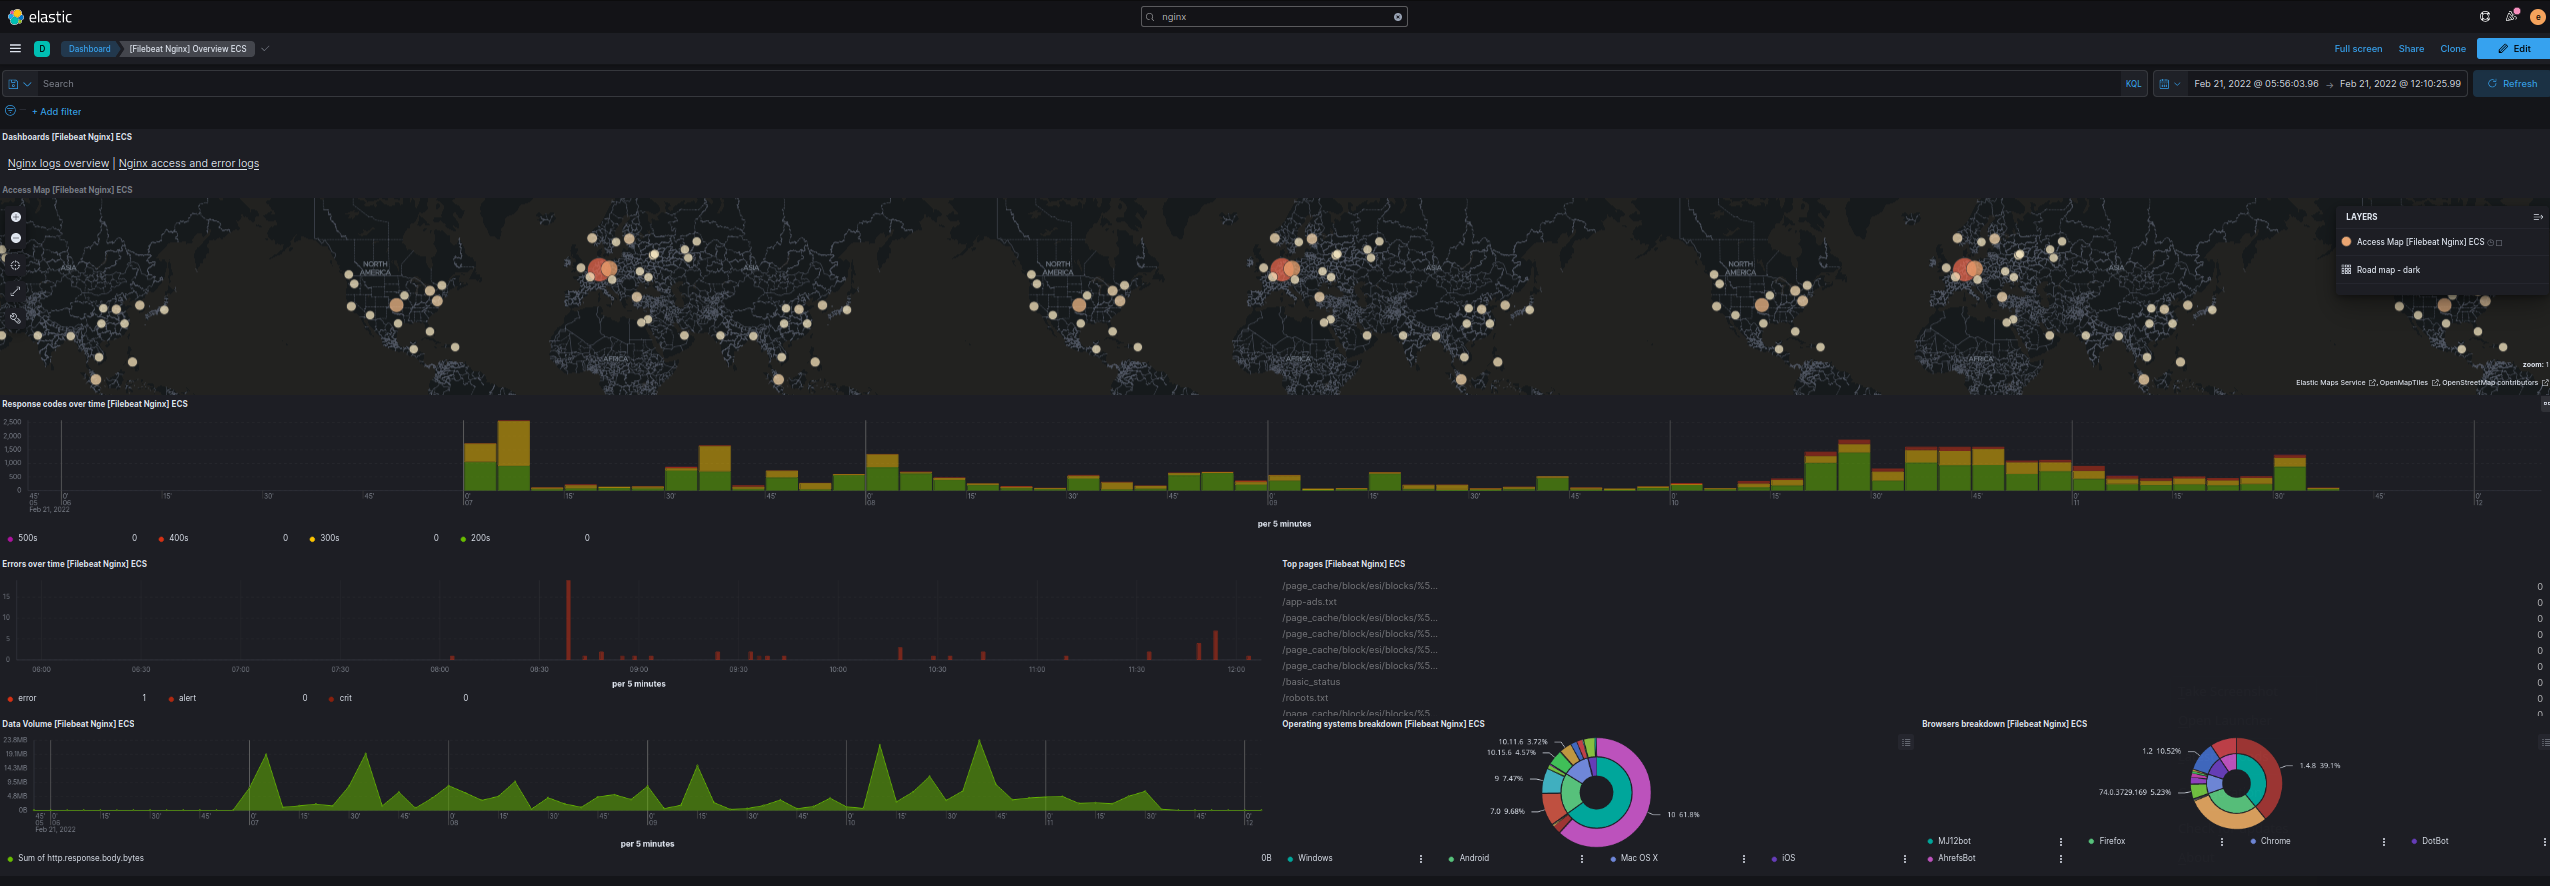
And can start analyzing my data:
Monitor NGINX in Docker
Configure filebeat to read the StdOut und StdErr stream of your NGINX container:
filebeat.autodiscover:
  providers:
    - type: docker
      hints.enabled: true
      templates:
        - condition.contains:
            docker.container.image: nginx
          config:
            - module: nginx
              access.input:
                type: docker
                containers:
                  ids: "${data.docker.container.id}"
                  stream: "stdout"
              error.input:
                type: docker
                containers:
                  ids: "${data.docker.container.id}"
                  stream: "stderr"
Run the Filebeat container inside the same Docker network as your NGINX container:
docker run -d \
  --name filebeat \
  --user root \
  --network mynetwork \
  --restart unless-stopped \
  -v /opt/beats/config/filebeat.yml:/usr/share/filebeat/filebeat.yml \
  -v /var/lib/docker/containers:/var/lib/docker/containers:ro \
  -v /var/run/docker.sock:/var/run/docker.sock:ro \
  elastic/filebeat:8.0.0
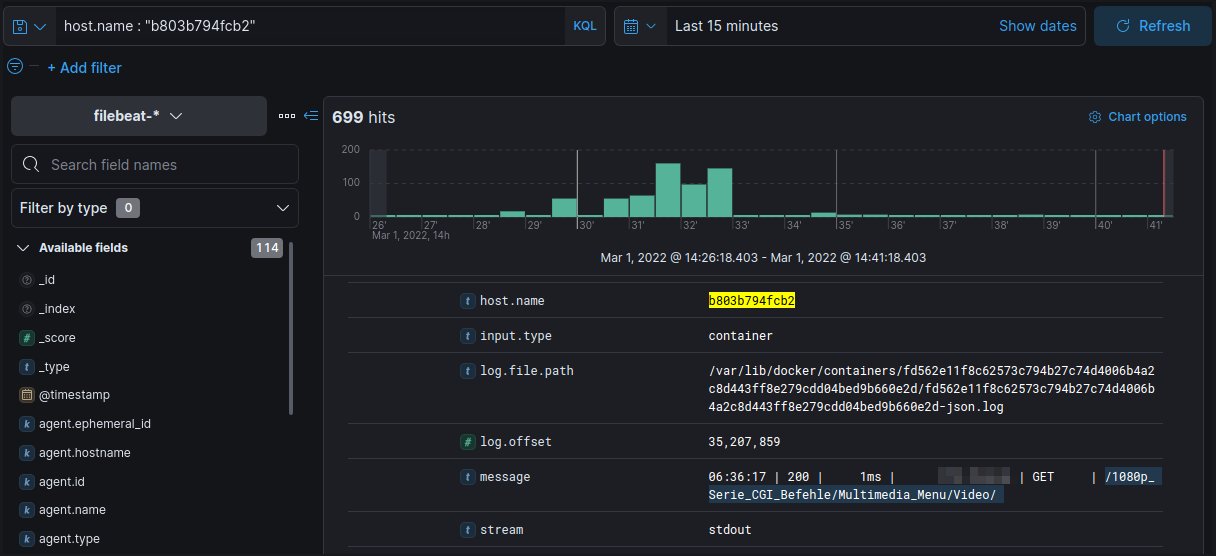
Since the container is now wrapped inside the virtual Docker network, I am now seeing the Filebeat Container ID as host.name. In my case b803b794fcb2:
docker ps
CONTAINER ID   IMAGE
b803b794fcb2   elastic/filebeat:8.0.0
Which I can use to filter all log entries from this beat:
host.name : "b803b794fcb2"
Alternative ?
Untested: Give the filepath to your container logs:
# # =========================== Filebeat autodiscover ============================

filebeat.autodiscover:
  providers:
    - type: docker
      templates:
        - condition:
            contains:
              docker.container.image:<your_label_condition>
          config:
            - type: container
              paths:
                - "/var/lib/docker/containers/${data.docker.container.id}/*.log"
              exclude_lines: ["^\\s+[\\-`('.|_]"]  # drop asciiart lines

filebeat.shutdown_timeout: 5s   #optional

# ------------------------------- Console Output -------------------------------
output.console:
  enabled: true
  codec.json:
    pretty: true
    escape_html: false

logging.metrics.enabled: false
Monitor Elasticsearch in Docker
I can now add my Elasticsearch container to the Filebeat configuration file:
filebeat.autodiscover
  providers:
    - type: docker
      hints.enabled: true
      templates:
        - condition.contains:
            docker.container.image: nginx
          config:
            - module: nginx
              access.input:
                type: docker
                containers:
                  ids: "${data.docker.container.id}"
                  stream: "stdout"
              error.input:
                type: docker
                containers:
                  ids: "${data.docker.container.id}"
                  stream: "stderr"
        - condition.contains:
            docker.container.image: docker.elastic.co/elasticsearch/elasticsearch
          config:
            - module: elasticsearch
              access.input:
                type: docker
                containers:
                  ids: "${data.docker.container.id}"
                  stream: "stdout"
              error.input:
                type: docker
                containers:
                  ids: "${data.docker.container.id}"
                  stream: "stderr"
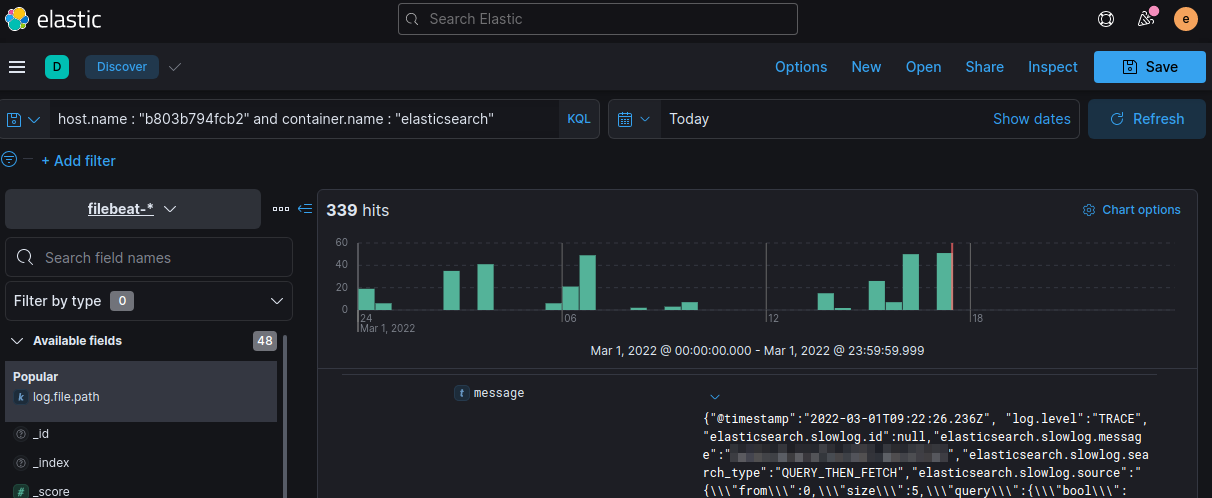
Since the Elasticsearch container name is set to elasticsearch I can now filter the Filebeat index with:
host.name : "b803b794fcb2" and container.name : "elasticsearch"
And see all outgoing search responses: