Elasticsearch 7 to log Linux System Events

Logstash together with Remote Syslog (rsyslog) can monitor remote host systems via an UDP or TCP connection. But I personally prefer to use Zabbix to monitor remote servers. But it might be interesting to spin up an ELK cluster on your server to debug a problem. For this I am going to use Logstash to monitor the local /var/log/syslog:
head -10 /var/log/syslog
Configuring Logstash
And I am going to use the Coralogix Logstash configuration file to run Logstash:
input {
  file {
     path => ["/usr/share/logstash/syslog"]
     type => "syslog"
     start_position => "beginning"
   }
}
filter {
       if [type] == "syslog" {
    grok {
      match => { "message" => "%{SYSLOGTIMESTAMP:syslog_timestamp} %{SYSLOGHOST:syslog_hostname} %{DATA:syslog_program}(?:\[%{POSINT:syslog_pid}\])?: %{GREEDYDATA:syslog_message}" }
      add_field => [ "received_at", "%{@timestamp}" ]
      add_field => [ "received_from", "%{host}" ]
    }
    date {
      match => [ "syslog_timestamp", "MMM  d HH:mm:ss", "MMM dd HH:mm:ss" ]
      target => "syslog_timestamp"
    }
  }
}
output{
  elasticsearch{
    hosts => ["localhost:9200"]
    index => "syslog-monitor"
  }
}
Running Logstash
I will now try to ingest the entire log into Elasticsearch using my Logstash container:
docker run \
   --name logstash \
   --net=host \
   --rm -it \
   -v /opt/logstash/pipeline/logstash.conf:/usr/share/logstash/pipeline/logstash.conf \
   -v /var/log/syslog:/usr/share/logstash/syslog:Z \
   -e "ELASTIC_HOST=localhost:9200" \
   -e "XPACK_SECURITY_ENABLED=false" \
   -e "XPACK_REPORTING_ENABLED=false" \
   -e "XPACK_MONITORING_ENABLED=false" \
   -e "XPACK_MONITORING_ELASTICSEARCH_USERNAME=elastic" \
   -e "XPACK_MONITORING_ELASTICSEARCH_PASSWORD=changeme" \
   logstash:7.13.4
I ran into permission issues here:
failed to open file {:path=>"/usr/share/logstash/syslog", :exception=>Errno::EACCES, :message=>"Permission denied - /usr/share/logstash/syslog"}. Had to chmod the syslog file to give Docker access.
Logstash is running quietly in the background. To check if there is content data being indexed run the following command and you should see last 2 documents that were generated:
curl -XGET "http://localhost:9200/syslog-monitor/_search?pretty" -H 'Content-Type: application/json' -d ' { "size": 2 }'
And it looks like it is working:
{
  "took" : 0,
  "timed_out" : false,
  "_shards" : {
    "total" : 1,
    "successful" : 1,
    "skipped" : 0,
    "failed" : 0
  },
  "hits" : {
    "total" : {
      "value" : 8307,
      "relation" : "eq"
    },
    "max_score" : 1.0,
    "hits" : [
      {
        "_index" : "syslog-monitor",
        "_type" : "_doc",
        "_id" : "CBVIDHsBhWUvimFeD-Tj",
        "_score" : 1.0,
        "_source" : {
          "syslog_message" : "var-lib-docker-overlay2-eb8de377cf683367ca97a620a723c4c6ddd7ccd68090fb050c9ab427ea5c2d47-merged.mount: Succeeded.",
          "type" : "syslog",
          "syslog_program" : "systemd",
          "syslog_hostname" : "debian11",
          "received_at" : "2021-08-03T13:50:54.304Z",
          "syslog_timestamp" : "2021-08-03T21:46:24.000Z",
          "host" : "debian11",
          "@timestamp" : "2021-08-03T13:50:54.304Z",
          "path" : "/usr/share/logstash/syslog",
          "syslog_pid" : "1",
          "received_from" : "debian11",
          "message" : "Aug  3 21:46:24 debian11 systemd[1]: var-lib-docker-overlay2-eb8de377cf683367ca97a620a723c4c6ddd7ccd68090fb050c9ab427ea5c2d47-merged.mount: Succeeded.",
          "@version" : "1"
        }
      },
      {
        "_index" : "syslog-monitor",
        "_type" : "_doc",
        "_id" : "CRVLDHsBhWUvimFeuuQO",
        "_score" : 1.0,
        "_source" : {
          "@timestamp" : "2021-08-03T13:54:53.923Z",
          "syslog_message" : "Finished Rotate log files.",
          "type" : "syslog",
          "host" : "debian11",
          "syslog_hostname" : "debian11",
          "received_at" : "2021-08-03T13:54:53.923Z",
          "received_from" : "debian11",
          "syslog_program" : "systemd",
          "@version" : "1",
          "path" : "/usr/share/logstash/syslog",
          "syslog_timestamp" : "2021-08-01T17:55:44.000Z",
          "syslog_pid" : "1",
          "message" : "Aug  1 17:55:44 debian11 systemd[1]: Finished Rotate log files."
        }
      }
    ]
  }
}
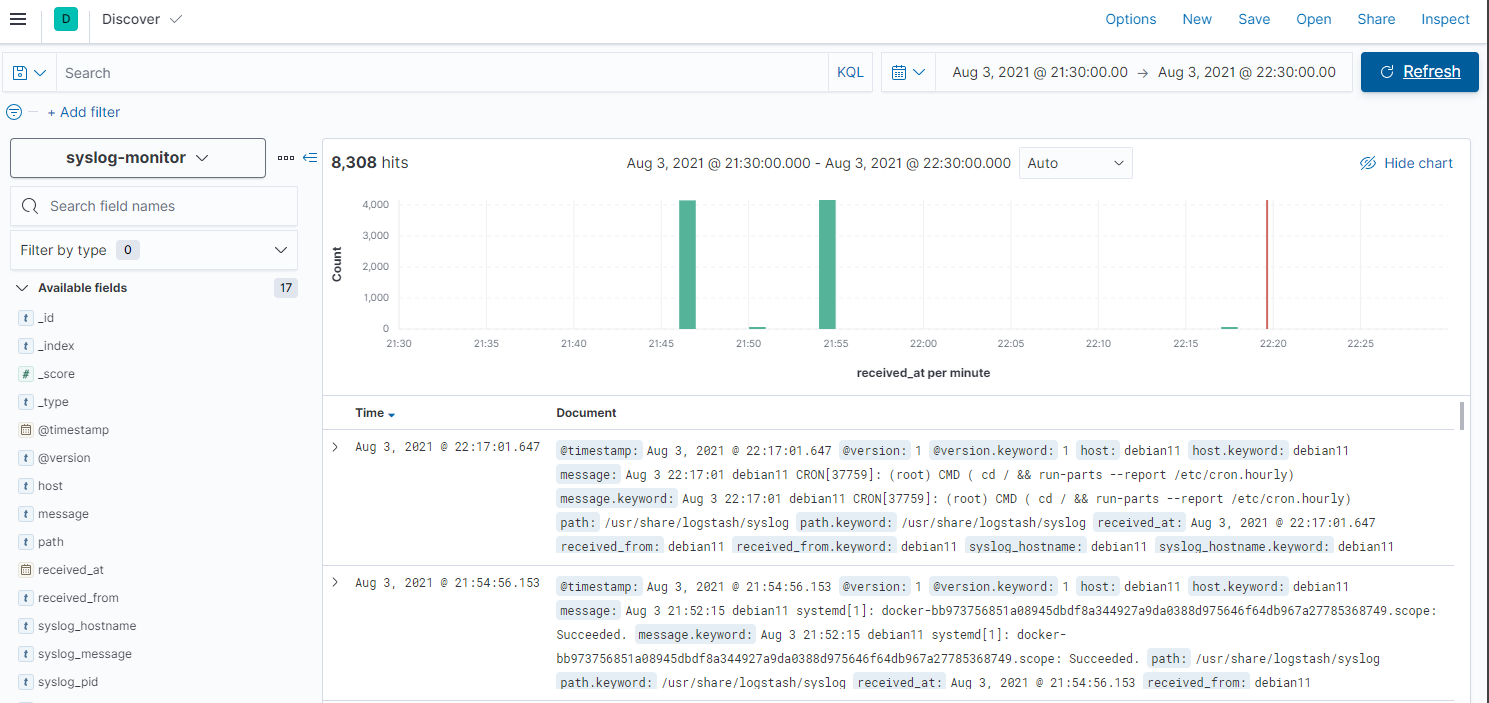
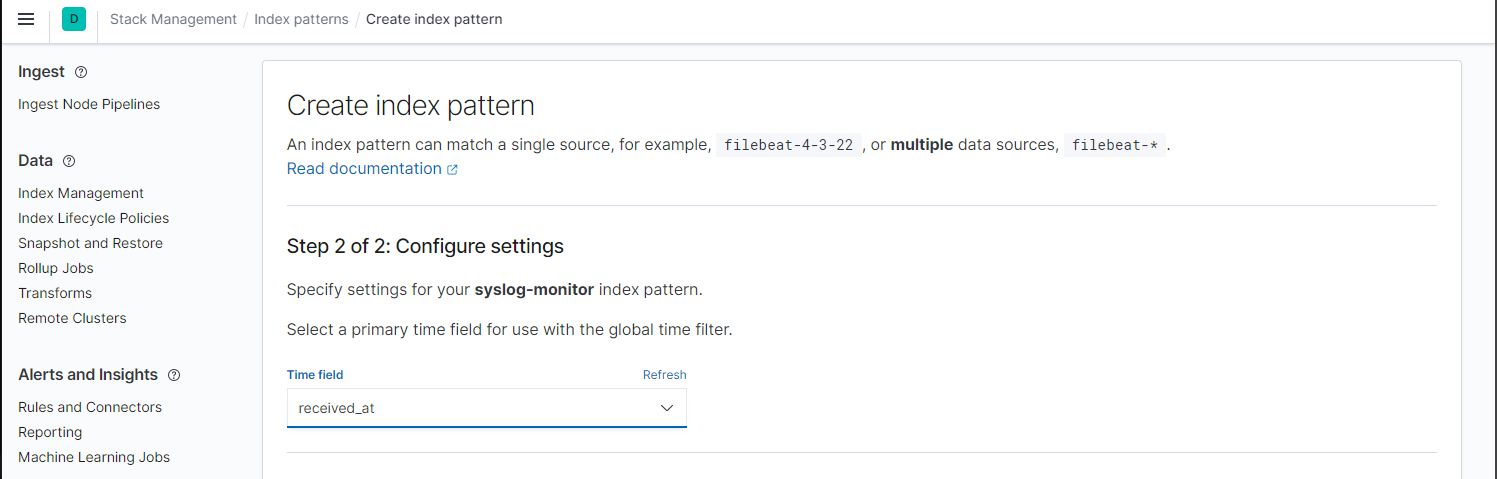
Kibana
I can now create an Index Pattern in Kibana with received_at as the primary time field:
And drill down the log entries on a time line: