Elastic Filebeat and NGINX Access Logs

- Installing Filebeat Kibana Dashboards
- Filebeats Modules
- Running Filebeat
- Using the Filebeat Dashboards
Installing Filebeat Kibana Dashboards
Filebeat comes with a couple of modules (NGINX, Apache, etc.) and fitting Kibana dashboards to help you visualize ingested logs. To install those dashboards in Kibana, you need to run the docker container with the setup command:
docker run --net="host" docker.elastic.co/beats/filebeat-oss:7.14.0-amd64 setup --dashboards

Loading dashboards (Kibana must be running and reachable)
Loaded dashboards
Make sure that Elasticsearch and Kibana are running and this command will just run through and exit after it successfully installed the dashboards.
Filebeats Modules
I now want to ingest a Apache access log into Elasticsearch using the appropriated Apache module in Filebeats.
Edit your Filebeat Config
nano /opt/beats/config/filebeat.yml
filebeat.config:
  modules:
    path: ${path.config}/modules.d/*.yml # enable all modules (nginx, kafka, redis, etc)
    reload.enabled: false

output.elasticsearch:
  hosts: 'localhost:9200'
  username: 'elastic'
  password: 'changeme'
Add your Module Config
nano /opt/beats/config/nginx.yml
# Module: nginx
# Docs: https://www.elastic.co/guide/en/beats/filebeat/7.x/filebeat-module-nginx.html

- module: nginx
  # Access logs
  access:
    enabled: true

    # Set custom paths for the log files. If left empty,
    # Filebeat will choose the paths depending on your OS.
    var.paths:
      - '/opt/nginx_access.log'

  # Error logs
  error:
    enabled: false

    # Set custom paths for the log files. If left empty,
    # Filebeat will choose the paths depending on your OS.
    # var.paths:

  # Ingress-nginx controller logs. This is disabled by default. It could be used in Kubernetes environments to parse ingress-nginx logs
  ingress_controller:
    enabled: false

    # Set custom paths for the log files. If left empty,
    # Filebeat will choose the paths depending on your OS.
    #var.paths:
Remember to write the path variable here as an array! If you try to just copy&paste in the path string you will get the following error message:
ERROR instance/beat.go:989 Exiting: Failed to start crawler: creating module reloader failed: could not create module registry for filesets: error getting config for fileset nginx/access: Error interpreting the template of the input: template: text:3:22: executing "text" at <.paths>: range can't iterate over /opt/nginx_access.log
Running Filebeat
As before we can now run the Filebeat container using our updated configuration file:
docker run -d \
  --name filebeat \
  --user root \
  --net=host \
  --rm \
  -v /opt/beats/config/filebeat.yml:/usr/share/filebeat/filebeat.yml \
  -v /opt/beats/logs/nginx_access.log:/opt/nginx_access.log \
  -v /opt/beats/config/nginx.yml:/usr/share/filebeat/modules.d/nginx.yml \
  -v /var/lib/docker/containers:/var/lib/docker/containers:ro \
  -v /var/run/docker.sock:/var/run/docker.sock:ro \
  docker.elastic.co/beats/filebeat-oss:7.14.0-amd64
Check if the index was created:
curl -XGET 'localhost:9200/_cat/indices?v'

health status index                             uuid                   pri rep docs.count docs.deleted store.size pri.store.size
yellow open   filebeat-7.14.0-2021.08.11-000001 7rJzWZOeRtePEbXv4keMuA   1   1       1411            0      1.4mb          1.4mb
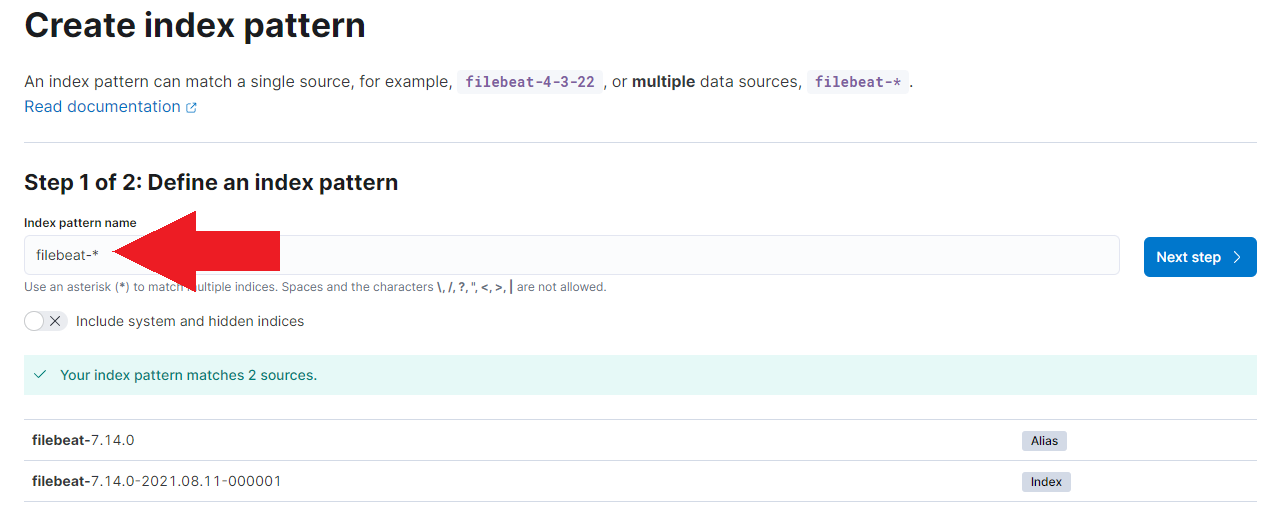
You can now create an index pattern for filebeat-*:
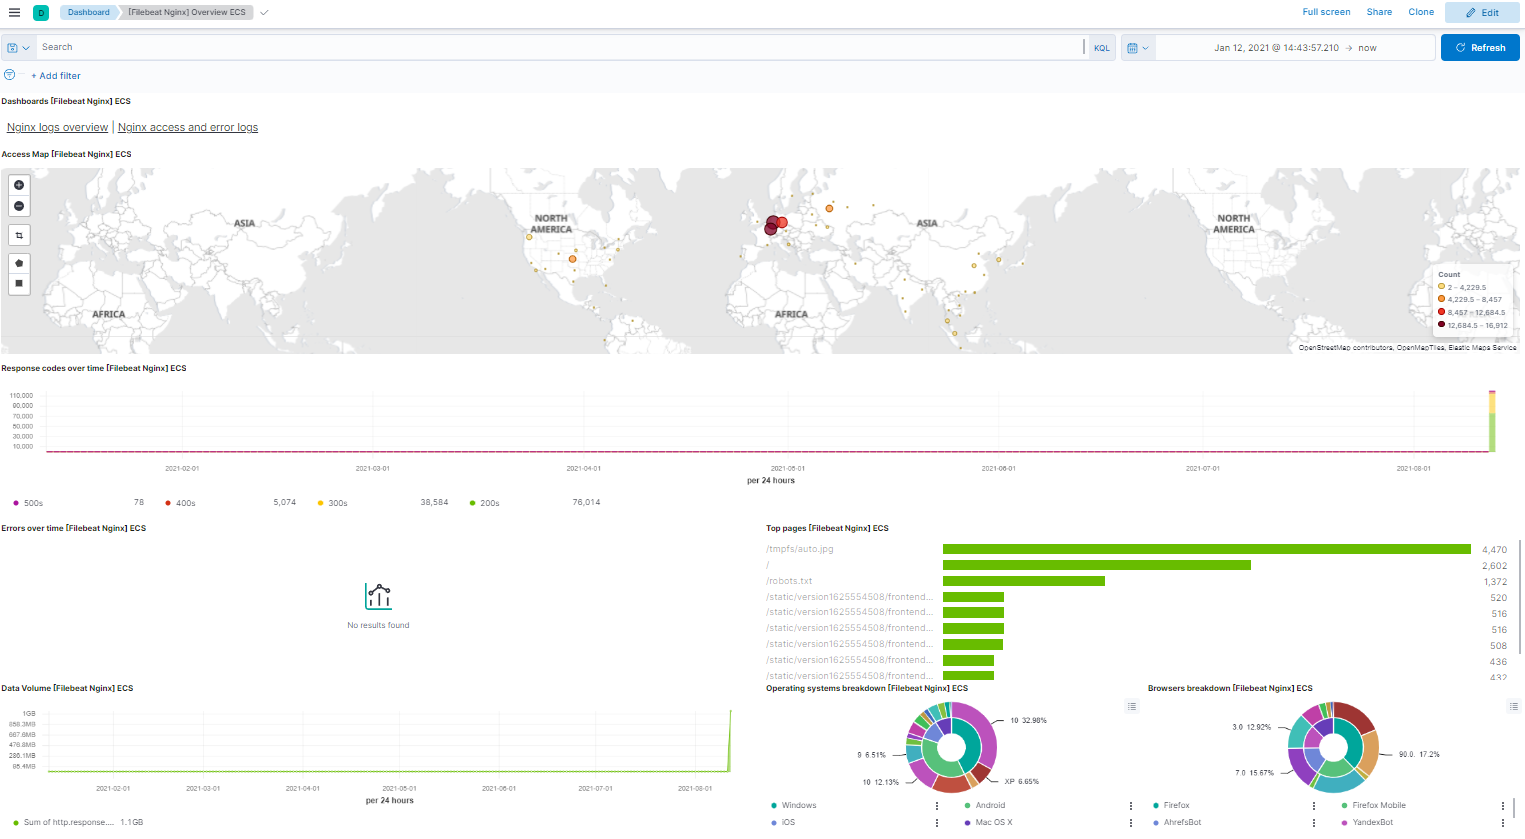
Using the Filebeat Dashboards
And now back to the new dashboards we installed in the beginning. Go to the dashboard menu and select the [Filebeat Apache] Access and error logs ECS dashboard.
ERROR Message:
Could not locate that index-pattern (id: filebeat-*), click here to re-create it- I go this message when I tried to open the Filebeat Apache Dashboard. I had to re-do the installation after the index was created - then it worked.
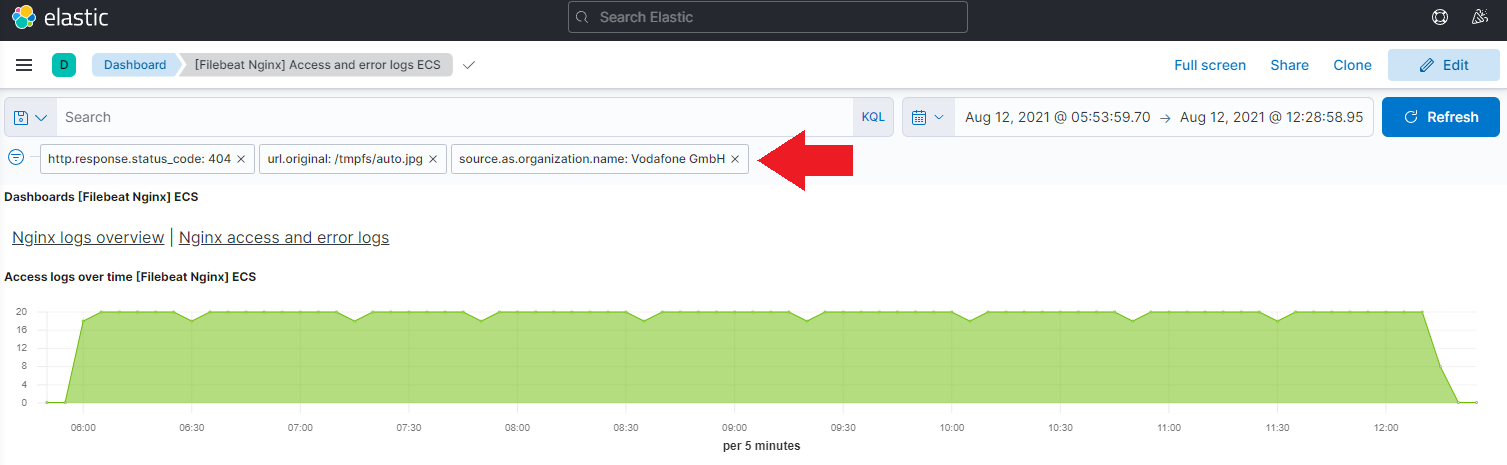
The visualisation below shows the same search for server errors on our new dashboard:
You can use the dashboard to filter your data and search for the source of issues. E.g. What Provider were those GET requests coming from that resulted in an 404 error: