Logstash 7 and Common Log Pattern

Working with common Log Formats
You can find a variety of of typical server logs in an repository by Coralogix : Logstash Resources:
├── logs
│  ├── apache
│  │  ├── access_log
│  │  ├── apache-access-enriched.conf
│  │  ├── apache-access-final-modified.conf
│  │  ├── apache-access-final.conf
│  │  ├── apache.log
│  │  └── log guide
│  ├── aws_alb
│  │  ├── alb_logs.log
│  │  └── aws-alb.conf
│  ├── aws_cloudfront
│  │  ├── aws-cloudfront.conf
│  │  └── cloudfront_logs.log
│  ├── aws_elb
│  │  ├── aws-elb.conf
│  │  └── elb_logs.log
│  ├── commands help.txt
│  ├── elasticsearch_logs
│  │  ├── elasticsearch.log
│  │  └── es-logs-final.conf
│  ├── elasticsearch_slowlogs
│  │  ├── es-slowlog-final.conf
│  │  └── es_slowlog.log
│  ├── git_push.sh
│  ├── iis
│  │  ├── iis-final-working.conf
│  │  └── u_ex171118-sample.log
│  ├── mongodb
│  │  ├── mongodb-final.conf
│  │  └── mongodb.log
│  ├── mysql_slowlogs
│  │  ├── mysql-slow.log
│  │  └── mysql-slowlogs.conf
│  ├── nginx
│  │  ├── access.log
│  │  └── nginx-access-final.conf
│  └── syslog
│     ├── syslog-direct-final-02.conf
│     ├── syslog-direct-final.conf
│     ├── syslog-forward-tcp - rsyslog settings
│     └── syslog-forward-tcp.conf
NGINX Access Logs
Let's first take a look at the NGINX access.log:
114.119.167.35 - - [01/Jun/2020:08:34:45 +0000] "GET /blog/tag/mongodb/amp HTTP/1.1" 301 0 "-" "Mozilla/5.0 (Linux; Android 7.0;) AppleWebKit/537.36 (KHTML, like Gecko) Mobile Safari/537.36"

...
The corresponding Logstash config is also part of the repository nginx-access-final.conf:
input {
file {
   path => ["/usr/share/logstash/access.log"]
   start_position => "beginning"
   sincedb_path => "/dev/null"
 }
}
filter {
      grok {
        match => { "message" => ["%{IPORHOST:remote_ip} - %{DATA:user_name} \[%{HTTPDATE:access_time}\] \"%{WORD:http_method} %{DATA:url} HTTP/%{NUMBER:http_version}\" %{NUMBER:response_code} %{NUMBER:body_sent_bytes} \"%{DATA:referrer}\" \"%{DATA:agent}\""] }
        remove_field => "message"
      }
      mutate {
        add_field => { "read_timestamp" => "%{@timestamp}" }
      }
      date {
        match => [ "timestamp", "dd/MMM/YYYY:H:m:s Z" ]
        remove_field => "timestamp"
      }
}
output{
  elasticsearch{
    hosts => ["localhost:9200"]
    index => "nginx-access-log"
  }
  stdout {
    codec => "rubydebug"
   }
}
We can test the Grok Pattern in the Grok Debugger:
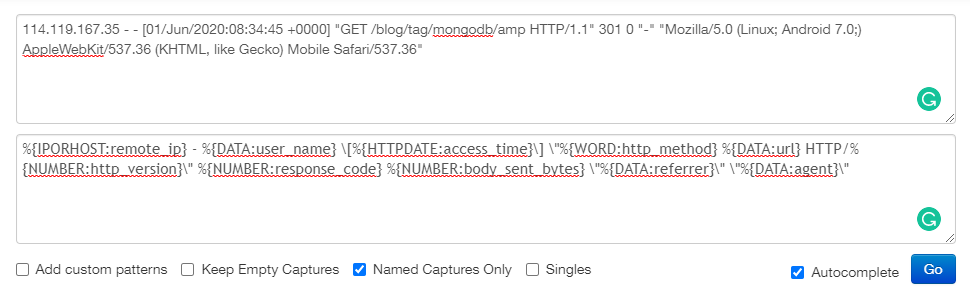
This will give us the following result:
{
  "remote_ip": [["114.119.167.35"]],
  "user_name": [["-"]],
  "access_time": [["01/Jun/2020:08:34:45 +0000"]],
  "http_method": [["GET"]],
  "url": [["/blog/tag/mongodb/amp"]],
  "http_version": [["1.1"]],
  "response_code": [["301"]],
  "body_sent_bytes": [["0"]],
  "referrer": [["-"]],
  "agent": [
    [
      "Mozilla/5.0 (Linux; Android 7.0;) AppleWebKit/537.36 (KHTML, like Gecko) Mobile Safari/537.36"
    ]
  ]
}
I will now try to ingest the entire log into Elasticsearch using my Logstash container:
docker run \
   --name logstash \
   --net=host \
   --rm -it \
   -v /opt/logstash/logs/nginx/nginx-access-final.conf:/usr/share/logstash/pipeline/nginx-access-final.conf \
   -v /opt/logstash/logs/nginx/access.log:/usr/share/logstash/access.log \
   -e "ELASTIC_HOST=localhost:9200" \
   -e "XPACK_SECURITY_ENABLED=false" \
   -e "XPACK_REPORTING_ENABLED=false" \
   -e "XPACK_MONITORING_ENABLED=false" \
   -e "XPACK_MONITORING_ELASTICSEARCH_USERNAME=elastic" \
   -e "XPACK_MONITORING_ELASTICSEARCH_PASSWORD=changeme" \
   logstash:7.13.4
You can query the indexed data with:
curl -XGET "http://localhost:9200/nginx-access-log/_search?pretty" -H 'Content-Type: application/json' -d'{
  "size": 1,
  "track_total_hits": true,
  "query": {
    "bool": {
      "must_not": [
        {
          "term": {
            "tags.keyword": "_grokparsefailure"
          }
        }
      ]
    }
  }
}'
This will return the first hit that wasn't not a parsing error:
"hits" : [
      {
        "_index" : "nginx-access-log",
        "_type" : "_doc",
        "_id" : "LBROC3sBhWUvimFeTT46",
        "_score" : 0.0,
        "_source" : {
          "user_name" : "-",
          "@version" : "1",
          "path" : "/usr/share/logstash/access.log",
          "read_timestamp" : "2021-08-03T09:18:04.356Z",
          "access_time" : "01/Jun/2020:15:49:10 +0000",
          "body_sent_bytes" : "131",
          "agent" : "Mozilla/5.0 (Windows NT 10.0; Win64; x64) AppleWebKit/537.36 (KHTML, like Gecko) Chrome/83.0.4103.61 Safari/537.36",
          "http_version" : "1.1",
          "referrer" : "https://www.techstuds.com/blog/join-in-mongodb/",
          "response_code" : "200",
          "url" : "/blog/join-in-mongodb/?relatedposts=1",
          "host" : "debian11",
          "remote_ip" : "73.44.199.53",
          "http_method" : "GET",
          "@timestamp" : "2021-08-03T09:18:04.356Z"
        }
      }
    ]
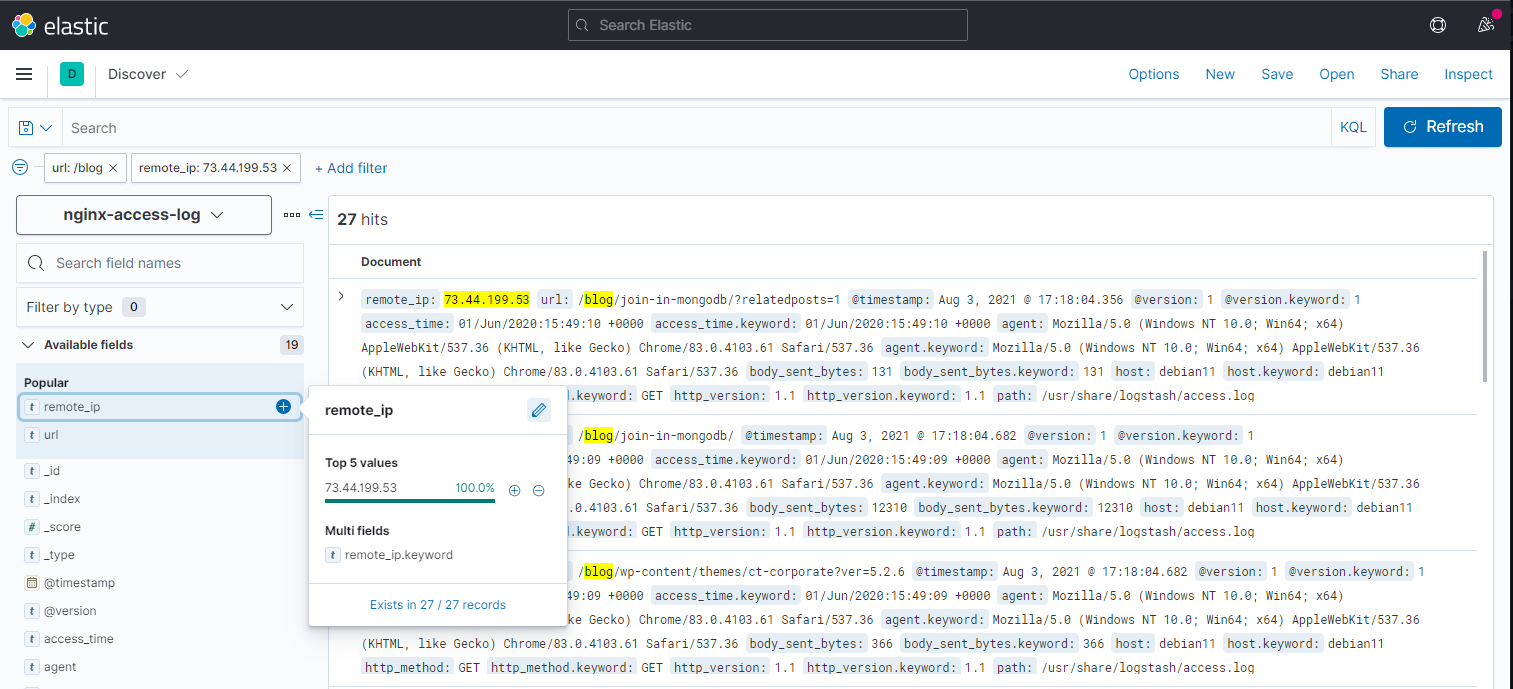
We can now create an index pattern in Kibana and e.g. check how often a certain IP address accessed an URL:
To delete the indexed data run:
curl -XDELETE -u elastic:changeme http://localhost:9200/nginx-access-log
Apache Access Logs
User Agent Mapping and Geo Location Mapping
Let's first take a look at the Apache access_log:
66.249.84.199 - - [30/Apr/2017:06:49:05 +0000] "GET /wp-content/plugins/revslider/public/assets/css/settings.css?ver=5.4.1 HTTP/1.1" 200 7067 "http://sundog-soft.com/2017/04/skymaxx-pro-4-5-coming/" "Mozilla/5.0 (Linux; Android 5.1.1; C6903 Build/14.6.A.1.236) AppleWebKit/537.36 (KHTML, like Gecko) Chrome/59.0.3071.25 Mobile Safari/537.36"

...
The corresponding Logstash config is also part of the repository apache-access-enriched.conf:
input {
file {
   path => ["/usr/share/logstash/access_log"]
   start_position => "beginning"
   sincedb_path => "/dev/null"
 }
}
filter {
      grok {
         match => { "message" => ["%{COMBINEDAPACHELOG}"] }
        remove_field => "message"
      }
      mutate {
        add_field => { "read_timestamp" => "%{@timestamp}" }
      }
      date {
        match => [ "timestamp", "dd/MMM/YYYY:H:m:s Z" ]
        remove_field => "timestamp"
      }
     useragent {
       source => "agent"
       target => "agent"
     }
     geoip {
       source => "clientip"
       target => "geoip"
     }
}
output {
  elasticsearch {
            hosts => [ "localhost:9200"]
            index => "apache-access-log"
        }
  stdout { codec => rubydebug }
}
docker run \
   --name logstash \
   --net=host \
   --rm -it \
   -v /opt/logstash/logs/apache/apache-access-enriched.conf:/usr/share/logstash/pipeline/apache-access-enriched.conf \
   -v /opt/logstash/logs/apache/access_log:/usr/share/logstash/access_log \
   -e "ELASTIC_HOST=localhost:9200" \
   -e "XPACK_SECURITY_ENABLED=false" \
   -e "XPACK_REPORTING_ENABLED=false" \
   -e "XPACK_MONITORING_ENABLED=false" \
   -e "XPACK_MONITORING_ELASTICSEARCH_USERNAME=elastic" \
   -e "XPACK_MONITORING_ELASTICSEARCH_PASSWORD=changeme" \
   logstash:7.13.4
curl -XGET "http://localhost:9200/apache-access-log/_search?pretty" -d'{
  "size": 1,
  "track_total_hits": true,
  "query": {
  "bool": {
    "must_not": [
      {
        "term": {
          "tags.keyword": "_grokparsefailure"
        }
      }
    ]
  }
  }
}'
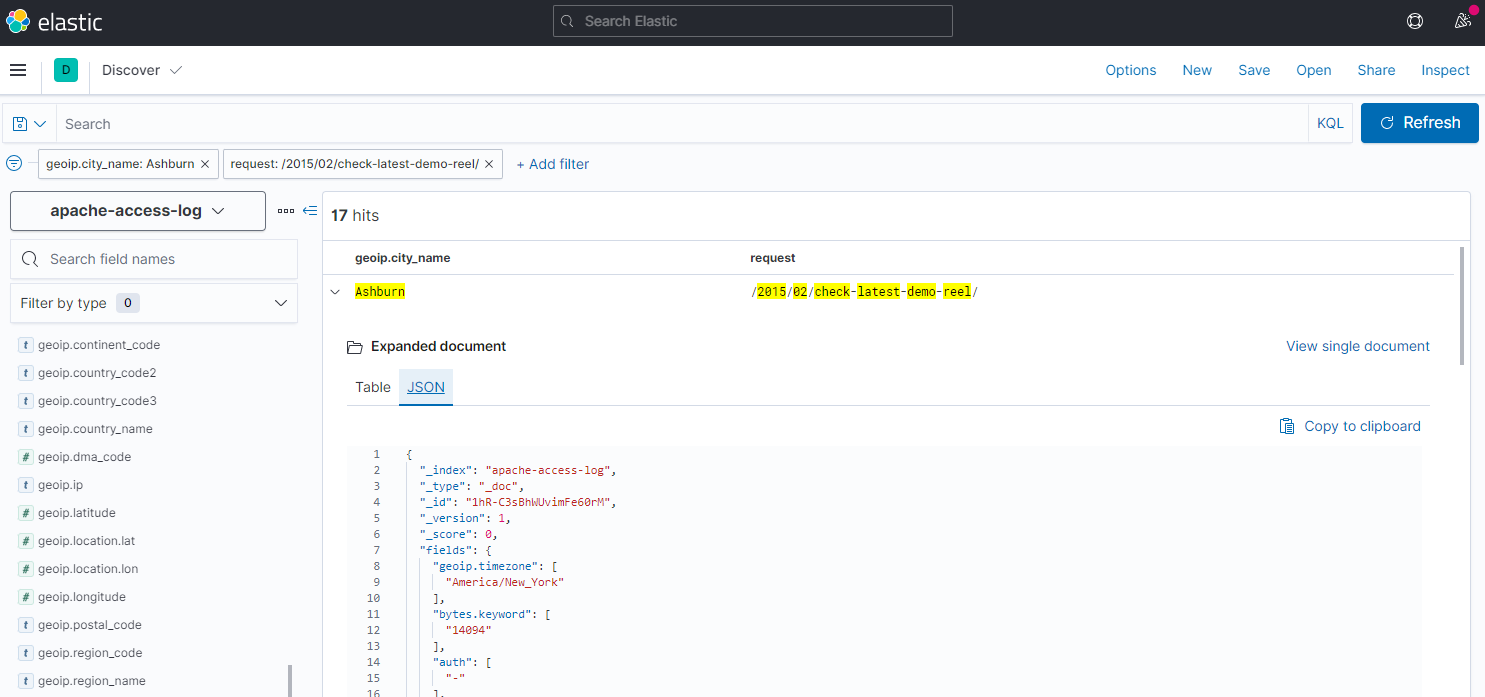
We can now create an index pattern in Kibana and e.g. check how often a users from a specific city accessed an URL:
To delete the indexed data run:
curl -XDELETE -u elastic:changeme http://localhost:9200/apache-access-log
Elasticsearch Logs
https://github.com/coralogix-resources/logstash/blob/master/elasticsearch_logs/es-logs-final.conf
input {
  file {
    path => "/etc/logstash/conf.d/logstash/elasticsearch_logs/elasticsearch.log"
    type => "elasticsearch"
    start_position => "beginning"
    sincedb_path => "/dev/null"
    codec => multiline {
      pattern => "^\["
      negate => true
      what => "previous"
    }
  }
}

filter {
  if [type] == "elasticsearch" {
    grok {
      match => [ "message", "\[%{TIMESTAMP_ISO8601:timestamp}\]\[%{DATA:severity}%{SPACE}\]\[%{DATA:source}%{SPACE}\]%{SPACE}(?<message>(.|\r|\n)*)" ]
      overwrite => [ "message" ]
    }

    if "_grokparsefailure" not in [tags] {
      grok {
        match => [
          "message", "^\[%{DATA:node}\] %{SPACE}\[%{DATA:index}\]%{SPACE}(?<short_message>(.|\r|\n)*)",
          "message", "^\[%{DATA:node}\]%{SPACE}(?<short_message>(.|\r|\n)*)" ]
        tag_on_failure => []
      }
    }
  }
}

output {
  elasticsearch {
            hosts => [ "localhost:9200"]
            index => "es-test-logs"
        }
  stdout { codec => rubydebug }
}
Elasticsearch Slow Logs
https://github.com/coralogix-resources/logstash/blob/master/elasticsearch_slowlogs/es_slowlog.log
input{
	file{
		path => ["/etc/logstash/conf.d/logstash/elasticsearch_slowlogs/es_slowlog.log"]
                start_position => "beginning"
                sincedb_path => "/dev/null"
		codec => plain {
                    charset => "ISO-8859-15" #Reads plaintext with no delimiting between events
        	}
	}
}
filter {
	grok {
		match => { "message" => ['\[%{TIMESTAMP_ISO8601:timestamp}\]\[%{LOGLEVEL:level}\]\[%{HOSTNAME:type}\]%{SPACE}\[%{HOSTNAME:[node_name]}\]%{SPACE}\[%{WORD:[index_name]}\]%{NOTSPACE}%{SPACE}took\[%{NUMBER:took_micro}%{NOTSPACE}\]%{NOTSPACE}%{SPACE}%{NOTSPACE}%{NOTSPACE}%{SPACE}%{NOTSPACE}%{NOTSPACE}%{SPACE}%{NOTSPACE}%{NOTSPACE}%{SPACE}search_type\[%{WORD:search_type}\]%{NOTSPACE}%{SPACE}total_shards\[%{NUMBER:total_shards}\]%{NOTSPACE}%{SPACE}source%{GREEDYDATA:query}\Z']}
	}

	mutate{
		remove_field => ["@version","@timestamp","host","path","logTook"]
	}
}
output{
	elasticsearch{
		hosts => ["localhost:9200"]
		index => "es-slow-logs"
	}
	stdout {
		codec => "rubydebug"
	 }
}
curl -XGET "http://localhost:9200/es-slow-logs/_search?pretty" -d'{ "size": 1}'
MySQL Slow Logs
https://raw.githubusercontent.com/coralogix-resources/logstash/master/mysql_slowlogs/mysql-slow.log
input {
file {
   path => ["/etc/logstash/conf.d/logstash/mysql_slowlogs/mysql-slow.log"]
   start_position => "beginning"
   sincedb_path => "/dev/null"
   codec => multiline {
          pattern => "^# Time: %{TIMESTAMP_ISO8601}"
          negate => true
          what => "previous"
        }
 }
}
filter {
      mutate {
        gsub => [
          "message", "#", "",
          "message", "\n", " "
        ]
        remove_field => "host"
      }
      grok {
        match => { "message" => [
              "Time\:%{SPACE}%{TIMESTAMP_ISO8601:timestamp}%{SPACE}User\@Host\:%{SPACE}%{WORD:user}\[%{NOTSPACE}\] \@ %{NOTSPACE:host} \[\]%{SPACE}Id\:%{SPACE}%{NUMBER:sql_id}%{SPACE}Query_time\:%{SPACE}%{NUMBER:query_time}%{SPACE}Lock_time\:%{SPACE}%{NUMBER:lock_time}%{SPACE}Rows_sent\:%{SPACE}%{NUMBER:rows_sent}%{SPACE}Rows_examined\:%{SPACE}%{NUMBER:rows_examined}%{SPACE}%{GREEDYDATA}; %{GREEDYDATA:command}\;%{GREEDYDATA}"
       ] }
      }

      mutate {
        add_field => { "read_timestamp" => "%{@timestamp}" }
        #remove_field => "message"
      }
}
output {
  elasticsearch {
            hosts => [ "localhost:9200"]
            index => "mysql-slowlogs-01"
        }
  stdout { codec => rubydebug }
}