Elasticsearch 7 Data Transformation

Preparing the Index
Elastic offers an NGINX Sample Log that we can use to experiment with:
wget https://raw.githubusercontent.com/elastic/examples/master/Common%20Data%20Formats/nginx_json_logs/nginx_json_logs
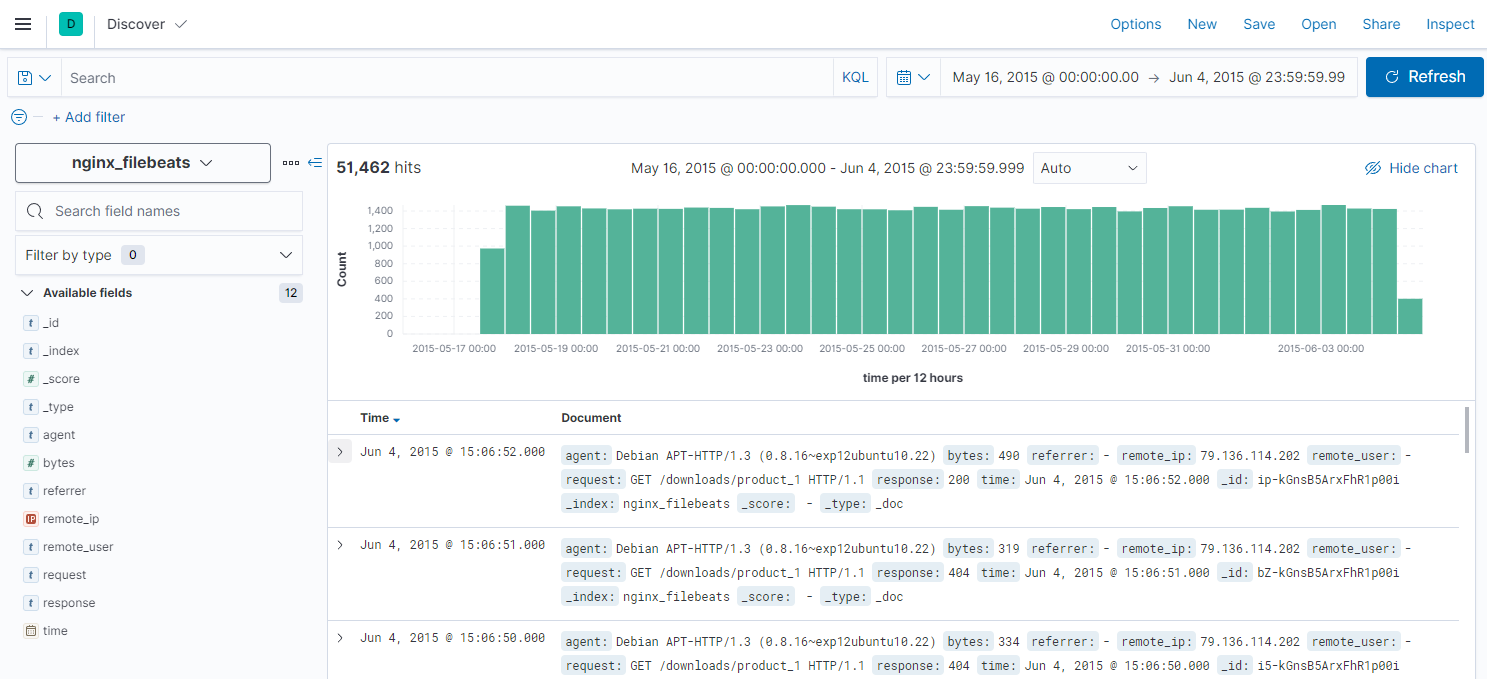
The data is a typical NGINX access log:
head -n 1 nginx_json_logs

{"time": "17/May/2015:08:05:32 +0000", "remote_ip": "93.180.71.3", "remote_user": "-", "request": "GET /downloads/product_1 HTTP/1.1", "response": 304, "bytes": 0, "referrer": "-", "agent": "Debian APT-HTTP/1.3 (0.8.16~exp12ubuntu10.21)"}
Creating the Mapping
We can use the following Elasticsearch mapping to index this data with the Kibana Dev Tools:
PUT /nginx_log
{
   "settings": {
       "number_of_shards": 1,
       "number_of_replicas": 0
   },
   "mappings": {
       "properties": {
           "time": {"type":"date","format":"dd/MMM/yyyy:HH:mm:ss Z"},
           "remote_ip": {"type":"ip"},
           "remote_user": {"type":"keyword"},
           "request": {"type":"keyword"},
           "response": {"type":"keyword"},
           "bytes": {"type":"long"},
           "referrer": {"type":"keyword"},
           "agent": {"type":"keyword"}
       }
   }
}
Bulk Data Import
We can now transform our data so that we are able to insert it into Elasticsearch using the Bulk API:
awk '{print "{\"index\":{}}\n" $0}' nginx_json_logs > nginx_json_logs_bulk
This will add an additional line above every single entry of the document - as needed by the Buld API:
head -n 2 nginx_json_logs_bulk

{"index":{}}
{"time": "17/May/2015:08:05:32 +0000", "remote_ip": "93.180.71.3", "remote_user": "-", "request": "GET /downloads/product_1 HTTP/1.1", "response": 304, "bytes": 0, "referrer": "-", "agent": "Debian APT-HTTP/1.3 (0.8.16~exp12ubuntu10.21)"}
We can now ingest the logfile with the following CURL command:
curl -H "Content-Type: application/x-ndjson" -XPOST 'localhost:9200/nginx_log/_doc/_bulk' --data-binary '@nginx_json_logs_bulk'
And verify that the index was created:
curl 'localhost:9200/_cat/indices/nginx_log?v'

health status index           uuid                   pri rep docs.count docs.deleted store.size pri.store.size
green  open   nginx_log LX1_DwvIQ_2q4nP-YYFYKA   1   0          0            0      1.3mb          1.3mb
We can also check Kibana for our new index:
Transformation
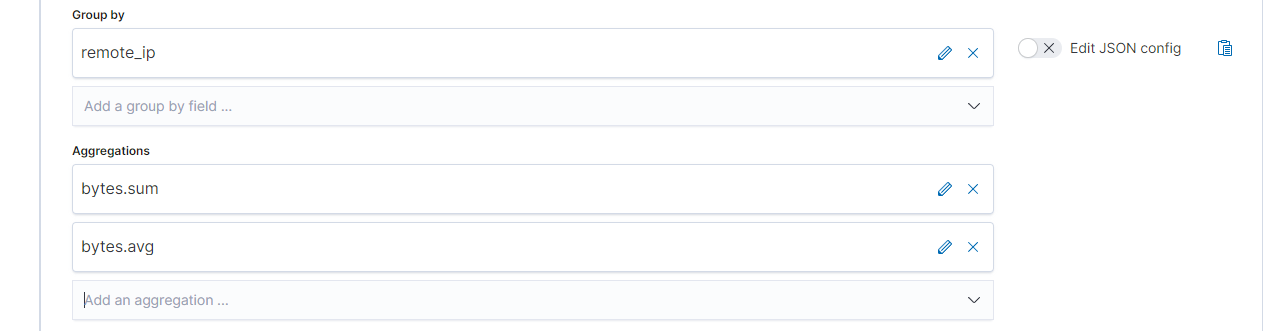
We can now transform our data by pivoting it around the field remote_ip - the command for it can be found here. This transformation will give us:
- Average number of bytes for an remote IP
- Total sum of the transferred bytes per IP
- Total number of requests from that IP
And below that, we also calculate the time of the first and last request written in the Elasticsearch Scripting Language Painless with request.first and request.last. By sending it to the Preview endpoint we will receive a preview of the transformation:
curl -H "Content-Type: application/x-ndjson" -XPOST 'http://localhost:9200/_transform/_preview' \
--data-raw '{
   "source": {
       "index": "nginx_log"
   },
   "pivot": {
       "group_by": {
           "ip": {
               "terms": {
                   "field": "remote_ip"
               }
           }
       },
       "aggregations": {
           "bytes.avg": {
               "avg": {
                   "field": "bytes"
               }
           },
           "bytes.sum": {
               "sum": {
                   "field": "bytes"
               }
           },
           "requests.total": {
               "value_count": {
                   "field": "_id"
               }
           },
           "requests.last": {
               "scripted_metric": {
                   "init_script": "state.timestamp = 0L; state.date = '\'''\''",
                   "map_script": "def doc_date = doc['\''time'\''].getValue().toInstant().toEpochMilli();if (doc_date > state.timestamp){state.timestamp = doc_date;state.date = doc['\''time'\''].getValue();}",
                   "combine_script": "return state",
                   "reduce_script": "def date = '\'''\'';def timestamp = 0L;for (s in states) {if (s.timestamp > (timestamp)){timestamp = s.timestamp; date = s.date;}} return date"
               }
           },
           "requests.first": {
               "scripted_metric": {
                   "init_script": "state.timestamp = 1609455599000L; state.date = '\'''\''",
                   "map_script": "def doc_date = doc['\''time'\''].getValue().toInstant().toEpochMilli();if (doc_date < state.timestamp){state.timestamp = doc_date;state.date = doc['\''time'\''].getValue();}",
                   "combine_script": "return state",
                   "reduce_script": "def date = '\'''\'';def timestamp = 0L;for (s in states) {if (s.timestamp > (timestamp)){timestamp = s.timestamp; date = s.date;}} return date"
               }
           }
       }
   }
}'
The Output shows us the average bytes per request by an remote IP, the sum of bytes of all request and the last and first time this IP address contacted our web service:
{"preview":[{"bytes":{"avg":2584.0,"sum":5168.0},"ip":"2.84.217.212","requests":{"total":2,"last":"2015-05-17T19:05:40.000Z","first":"2015-05-17T15:05:25.000Z"}}

...
We can now prepare the transformation to our data:
curl -H "Content-Type: application/x-ndjson" -XPUT 'http://localhost:9200/_transform/nginx_log_transform' \
--data-raw '{
   "source": {
       "index": "nginx_log"
   },
   "pivot": {
       "group_by": {
           "ip": {
               "terms": {
                   "field": "remote_ip"
               }
           }
       },
       "aggregations": {
           "bytes.avg": {
               "avg": {
                   "field": "bytes"
               }
           },
           "bytes.sum": {
               "sum": {
                   "field": "bytes"
               }
           },
           "requests.total": {
               "value_count": {
                   "field": "_id"
               }
           },
           "requests.last": {
               "scripted_metric": {
                   "init_script": "state.timestamp = 0L; state.date = '\'''\''",
                   "map_script": "def doc_date = doc['\''time'\''].getValue().toInstant().toEpochMilli();if (doc_date > state.timestamp){state.timestamp = doc_date;state.date = doc['\''time'\''].getValue();}",
                   "combine_script": "return state",
                   "reduce_script": "def date = '\'''\'';def timestamp = 0L;for (s in states) {if (s.timestamp > (timestamp)){timestamp = s.timestamp; date = s.date;}} return date"
               }
           },
           "requests.first": {
               "scripted_metric": {
                   "init_script": "state.timestamp = 1609455599000L; state.date = '\'''\''",
                   "map_script": "def doc_date = doc['\''time'\''].getValue().toInstant().toEpochMilli();if (doc_date < state.timestamp){state.timestamp = doc_date;state.date = doc['\''time'\''].getValue();}",
                   "combine_script": "return state",
                   "reduce_script": "def date = '\'''\'';def timestamp = 0L;for (s in states) {if (s.timestamp > (timestamp)){timestamp = s.timestamp; date = s.date;}} return date"
               }
           }
       }
   },
   "description": "Transferred bytes to remote IP addresses",
   "dest": {
     "index": "nginx_log_transformed"
     }
}'
To start the transformation and write it to a new index called nginx_log_transformed run the following command:
curl -XPOST 'http://localhost:9200/_transform/nginx_log_transform/_start'
And we will end up with the following index:
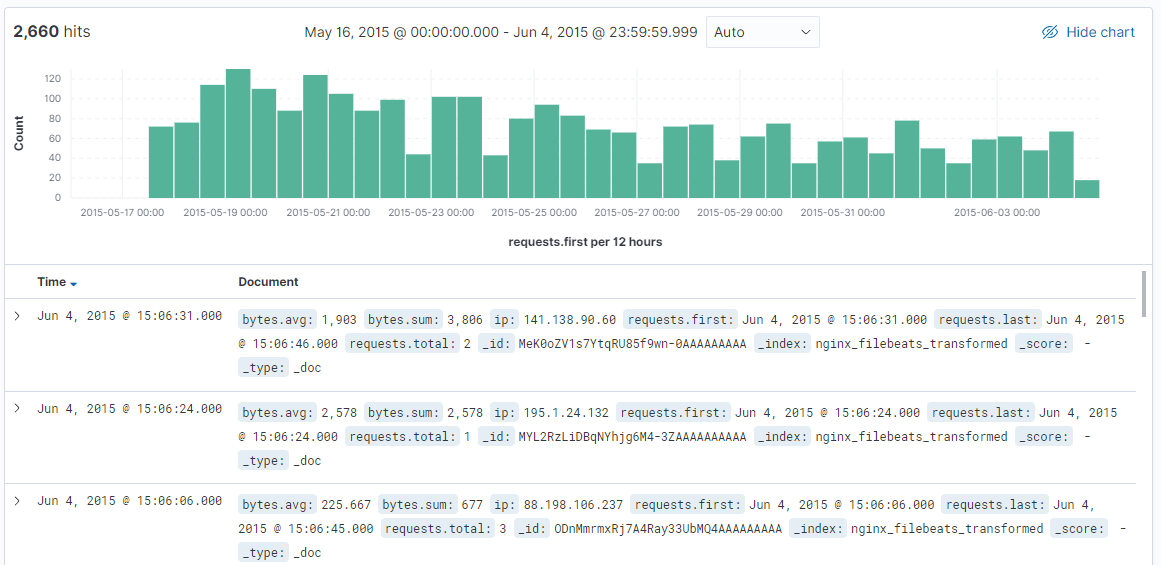
Showing the amount of remote IP's accessing our service. Clicking on a a bar in this histogram will list all the IP's and data that was transferred.
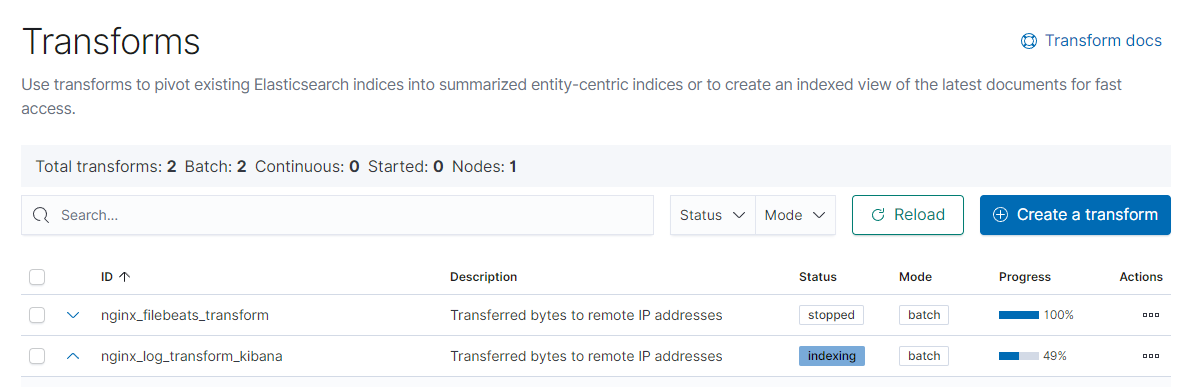
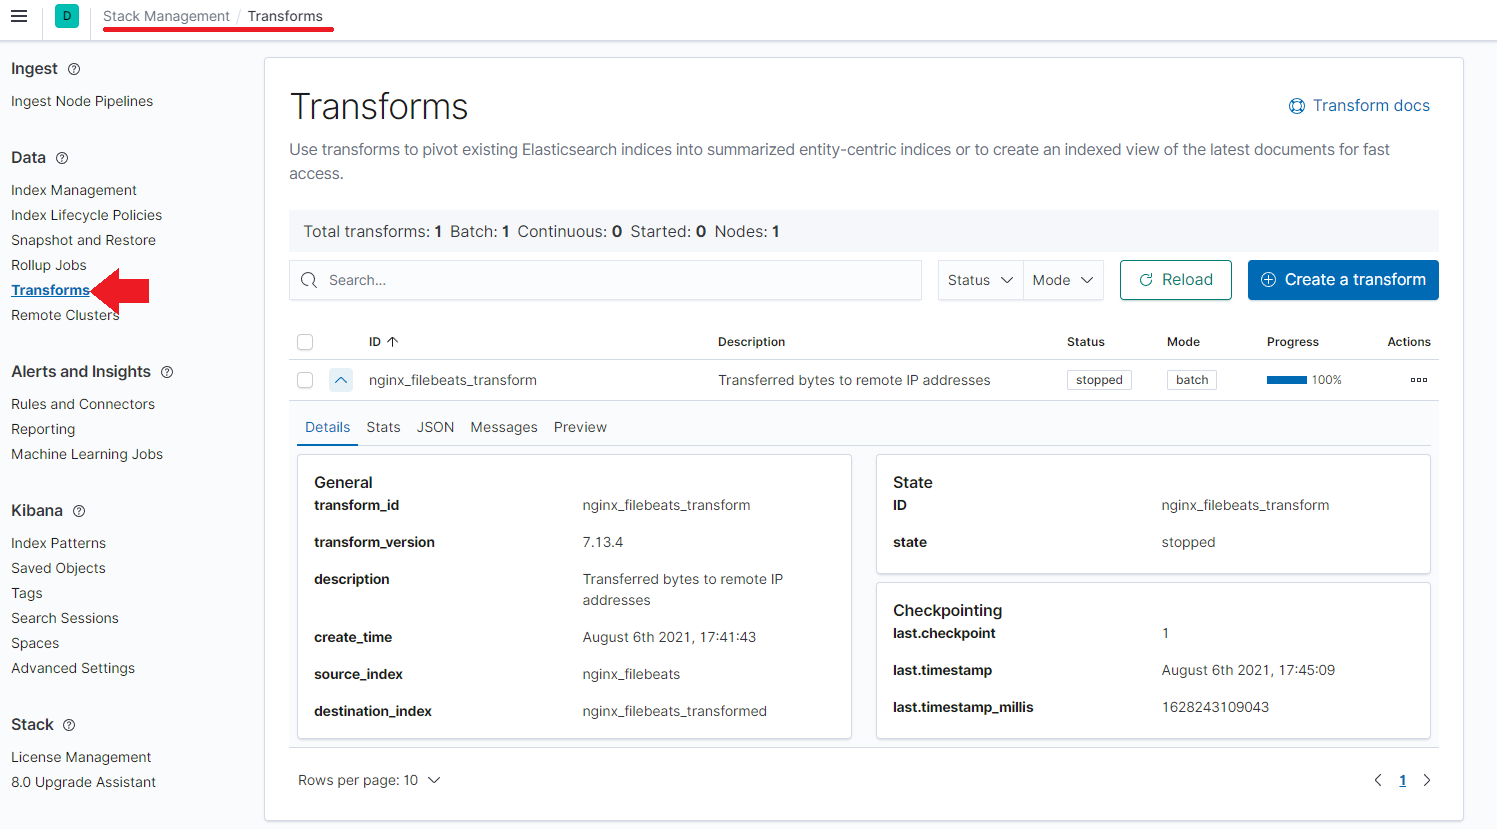
The Kibana Way
Access Kibana and open the Management tab. Here you can find the Elastisearch / Transformation interface that now holds all the information from our data transformation above.
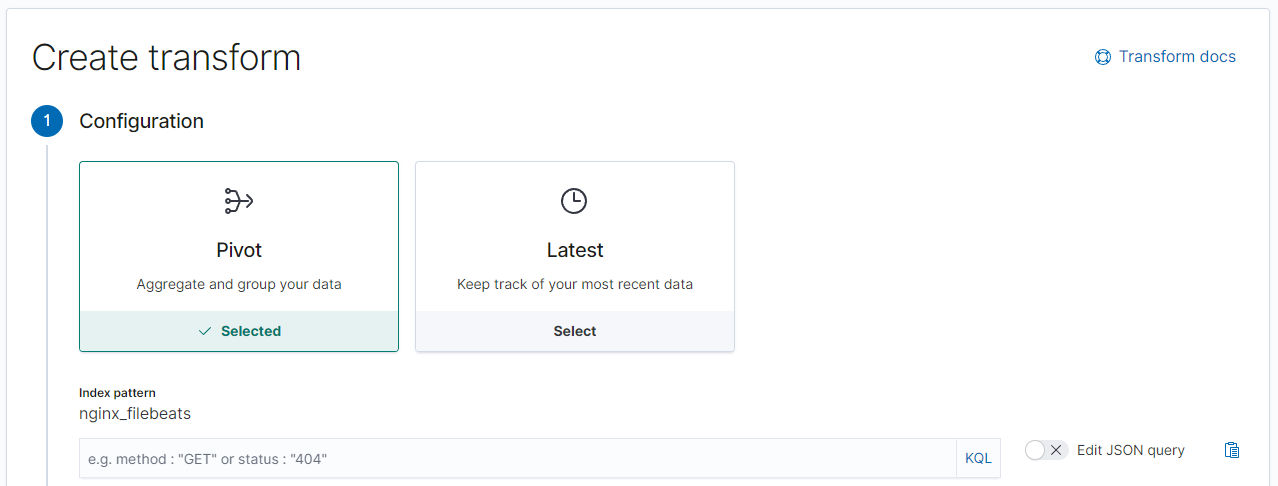
By clicking on Create Transformation it is also possible to go through the entire steps inside the Kibana interface. Start by selecting the index you want to transform:
And select your pivot and it's aggregations:
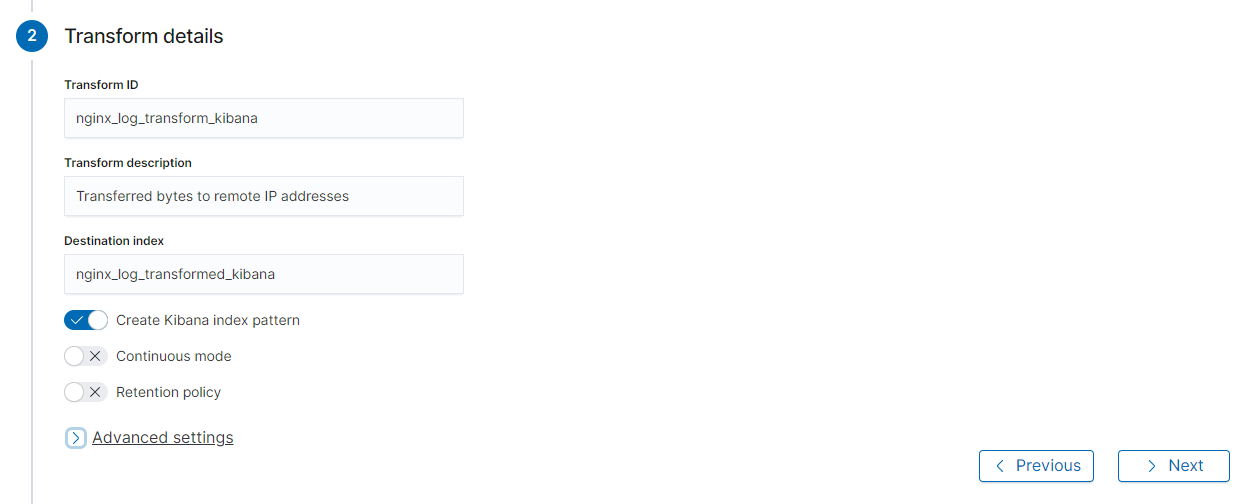
And assign the index that you want your transformed data to be written to:
In the next step I thought I could postpone the Start and edit the generated JSON instruction directly in Kibana - allowing me to add the Painless scripts we used above. But I could not find a way to do that :( So Painless only seems to be an option when you use CURL (?).
Hit Start:

And wait for the process to finish: