Elasticsearch 7 and Filebeats

Installation
Start by pulling the a fresh version of Elasticsearch, Kibana, (Logstash) and Filebeat:
https://www.docker.elastic.co/r/elasticsearchhttps://www.docker.elastic.co/r/kibanahttps://www.docker.elastic.co/r/logstashhttps://www.docker.elastic.co/r/beats
docker pull docker.elastic.co/elasticsearch/elasticsearch:7.14.0-amd64
docker pull docker.elastic.co/kibana/kibana:7.14.0-amd64
docker pull docker.elastic.co/logstash/logstash-oss:7.14.0-arm64
docker pull docker.elastic.co/beats/filebeat-oss:7.14.0-amd64
I will create a folder mkdir -p /opt/beats/config/ and continue working from there.
Setting Up Elasticsearch
nano /opt/beats/config/elasticsearch.yml
I will use the default Elasticsearch config and might edit it later on:
cluster.name: "elastic-cluster"
network.host: 0.0.0.0
xpack.security.enabled: false
xpack.monitoring.enabled: false
xpack.enrich.enabled: false
discovery.type: "single-node"
bootstrap.memory_lock: true
I will run the docker container on my host network:
docker run -d \
  --name elasticsearch \
  --net=host \
  -v /opt/beats/config/elasticsearch.yml:/usr/share/elasticsearch/config/elasticsearch.yml \
  docker.elastic.co/elasticsearch/elasticsearch:7.14.0-amd64
To persist your Elasticsearch data add another volume:
-v /opt/beats/esdata:/usr/share/elasticsearch/data
Wait a few second and verify that Elasticsearch is running:
curl localhost:9200
{
  "name" : "debian11",
  "cluster_name" : "elastic-cluster",
  "cluster_uuid" : "JJ4wNCADSmq8_xT_BKhMdw",
  "version" : {
    "number" : "7.14.0",
    "build_flavor" : "default",
    "build_type" : "docker",
    "build_hash" : "dd5a0a2acaa2045ff9624f3729fc8a6f40835aa1",
    "build_date" : "2021-07-29T20:49:32.864135063Z",
    "build_snapshot" : false,
    "lucene_version" : "8.9.0",
    "minimum_wire_compatibility_version" : "6.8.0",
    "minimum_index_compatibility_version" : "6.0.0-beta1"
  },
  "tagline" : "You Know, for Search"
}
Setting Up Kibana
nano /opt/beats/config/kibana.yml
I will use the default Kibana config and might edit it later on:
server.host: "0"
server.shutdownTimeout: "5s"
elasticsearch.hosts: [ "http://localhost:9200" ]
# elasticsearch.username: "elastic"
# elasticsearch.password: "changeme"
xpack.monitoring.elasticsearch.username: "elastic"
xpack.monitoring.elasticsearch.password: "changeme"
monitoring.ui.container.elasticsearch.enabled: true
I will run the docker container on my host network:
docker run -d \
  --name kibana \
  --net=host \
  -v /opt/beats/config/kibana.yml:/usr/share/kibana/config/kibana.yml \
  docker.elastic.co/kibana/kibana:7.14.0-amd64
Check if everything is connecting:
docker logs kibana

...

{"type":"log","@timestamp":"2021-08-09T06:44:07+00:00","tags":["info","status"],"pid":1213,"message":"Kibana is now available (was unavailable)"}
Make sure that you can access your Elastic Cluster from another system:
ufw allow 9200/tcp
ufw allow 5601/tcp
And open the Kibana frontend inside your web browser:
http://[my-cluster-ip]:5601/app/home#/
Setting Up Filebeat
nano /opt/beats/config/filebeat.yml
I will use the default Filebeat config and might edit it later on:
filebeat.config:
  modules:
    path: ${path.config}/modules.d/*.yml # enable all modules (nginx, kafka, redis, etc)
    reload.enabled: false

filebeat.autodiscover: # auto-discover tagged docker container
  providers:
    - type: docker
      hints.enabled: true

processors:
# - add_cloud_metadata: ~ # for AWS, GCO, Azure etc.
- add_docker_metadata: ~ # add docker metadata (container id, name, image and labels)

output.elasticsearch:
  hosts: 'localhost:9200'
  username: 'elastic'
  password: 'changeme'
The beat configuration file must belong to the root user and all write permissions for other users must be revoked:
chown root:root /opt/beats/config/filebeat.yml
chmod go-w /opt/beats/config/filebeat.yml
-rw-r--r-- 1 root root  202 14:36 elasticsearch.yml
-rw-r--r-- 1 root root  511 15:04 filebeat.yml
-rw-r--r-- 1 root root  250 14:43 kibana.yml
We need tp bind the location of docker container directory /var/lib/docker/containers and our docker socket /var/run/docker.sock to the container (Why? EDIT: For the Docker auto-discovery - remember to run container as root user!):
docker run -d \
  --name filebeat \
  --user root \
  --net=host \
  -v /opt/beats/config/filebeat.yml:/usr/share/filebeat/filebeat.yml \
  -v /var/lib/docker/containers:/var/lib/docker/containers:ro \
  -v /var/run/docker.sock:/var/run/docker.sock:ro \
  docker.elastic.co/beats/filebeat-oss:7.14.0-amd64
Check if everything started up:
docker logs filebeat

...

2021-08-09T07:15:53.744Z INFO Index Alias filebeat-7.14.0 successfully created.
2021-08-09T07:15:53.745Z INFO Connection to backoff(elasticsearch(http://localhost:9200)) established
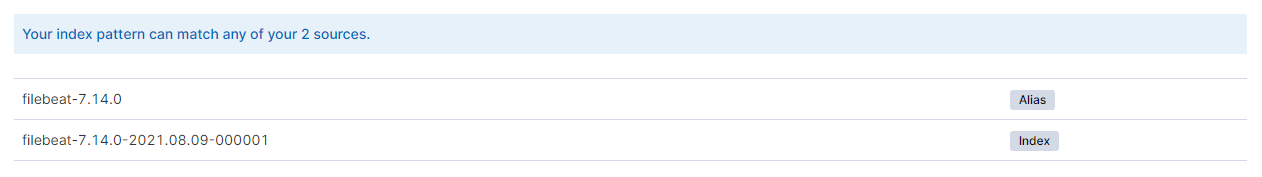
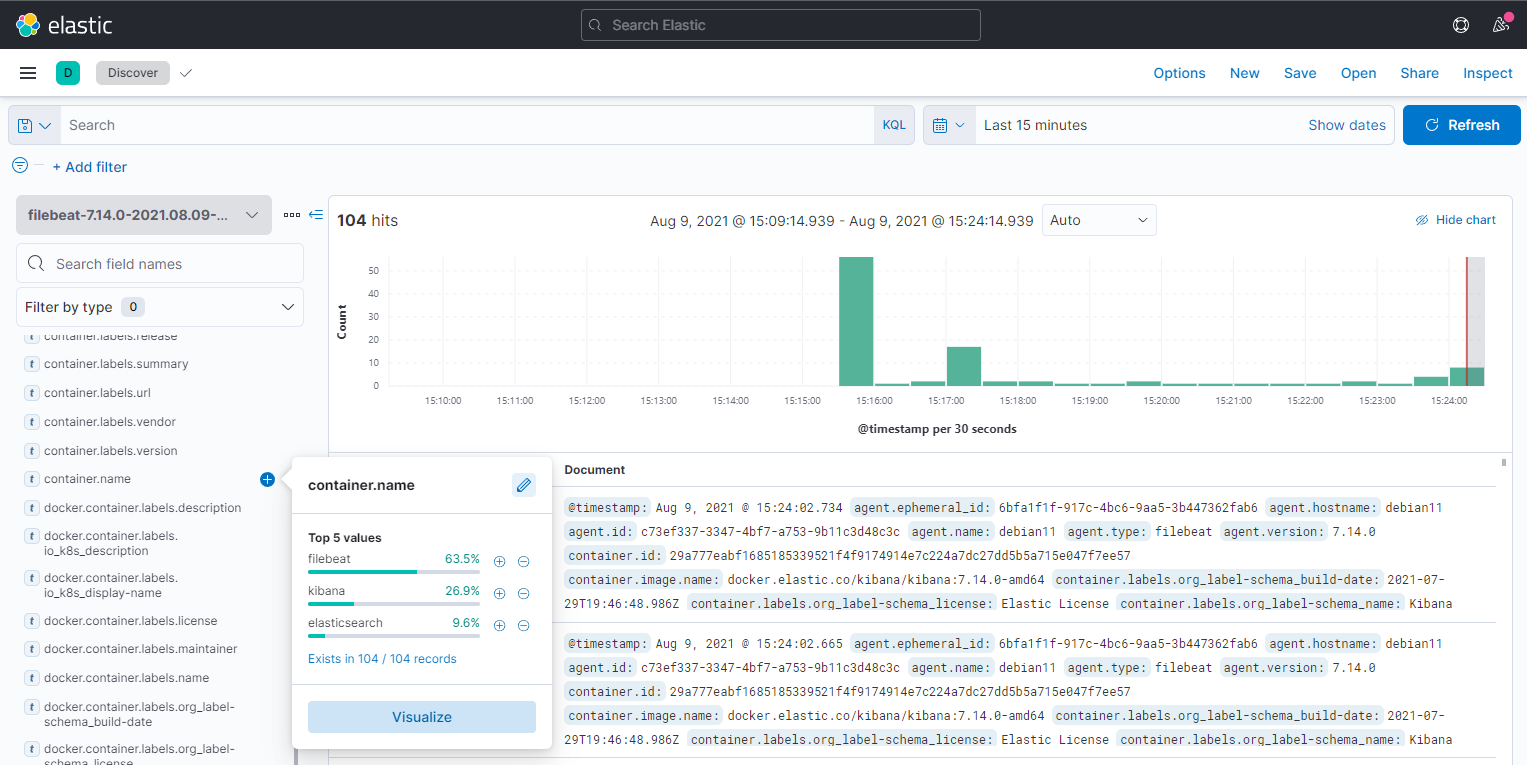
Switch over to Kibana and you should see that new indices were created:
The created index hauls plenty of information about your docker cluster:
Using Filebeats Modules
As mentioned before, Filebeat comes with a bunch Filebeat Modules that we can use to keep an eye on running containers. All that is needed to, e.g. feeding the webserver log of an NGINX Container into Elasticsearch, is to tag the container with co.elastic.logs/module=nginx:
docker run --label co.elastic.logs/module=nginx --name ingress -d -p 8080:80 nginx:1.21.1-alpine
You can test that the container is running:
docker ps --filter 'label=co.elastic.logs/module=nginx'
curl localhost:8080

<!DOCTYPE html>
<html>
<head>
<title>Welcome to nginx!</title>
<style>
    body {
        width: 35em;
        margin: 0 auto;
        font-family: Tahoma, Verdana, Arial, sans-serif;
    }
</style>
</head>
<body>
<h1>Welcome to nginx!</h1>
<p>If you see this page, the nginx web server is successfully installed and
working. Further configuration is required.</p>

<p>For online documentation and support please refer to
<a href="http://nginx.org/">nginx.org</a>.<br/>
Commercial support is available at
<a href="http://nginx.com/">nginx.com</a>.</p>

<p><em>Thank you for using nginx.</em></p>
</body>
</html>
I could not find the "Refresh Button" that should be in the Index Pattern menu in Kibana - so I rebuild the pattern and filtered for my ingress:
A typical NGINX event looks like this:
{
  "_index": "filebeat-7.14.0-2021.08.09-000001",
  "_type": "_doc",
  "_id": "Wx4gKnsBSe-TBw4pQoBr",
  "_score": 1,
  "_source": {
    "container": {
      "image": {
        "name": "nginx:1.21.1-alpine"
      },
      "name": "ingress",
      "id": "0b0ade2ce1fdee72d32db7b53ef566f9fe2314805cc1fa4b35649c7addb1c63a",
      "labels": {
        "co_elastic_logs/module": "nginx",
        "maintainer": "NGINX Docker Maintainers <docker-maint@nginx.com>"
      }
    },
    "agent": {
      "hostname": "debian11",
      "name": "debian11",
      "id": "c73ef337-3347-4bf7-a753-9b11c3d48c3c",
      "type": "filebeat",
      "ephemeral_id": "6bfa1f1f-917c-4bc6-9aa5-3b447362fab6",
      "version": "7.14.0"
    },
    "log": {
      "file": {
        "path": "/var/lib/docker/containers/0b0ade2ce1fdee72d32db7b53ef566f9fe2314805cc1fa4b35649c7addb1c63a/0b0ade2ce1fdee72d32db7b53ef566f9fe2314805cc1fa4b35649c7addb1c63a-json.log"
      },
      "offset": 3343
    },
    "fileset": {
      "name": "ingress_controller"
    },
    "error": {
      "message": "Provided Grok expressions do not match field value: [192.168.2.110 - - [09/Aug/2021:08:55:58 +0000] \\\"GET /favicon.ico HTTP/1.1\\\" 404 555 \\\"http://192.168.2.111:8080/\\\" \\\"Mozilla/5.0 (X11; Linux x86_64) AppleWebKit/537.36 (KHTML, like Gecko) Chrome/91.0.4472.164 Safari/537.36\\\" \\\"-\\\"]"
    },
    "docker": {
      "container": {
        "labels": {
          "co_elastic_logs/module": "nginx",
          "maintainer": "NGINX Docker Maintainers <docker-maint@nginx.com>"
        }
      }
    },
    "input": {
      "type": "container"
    },
    "@timestamp": "2021-08-09T08:55:58.767Z",
    "ecs": {
      "version": "1.10.0"
    },
    "stream": "stdout",
    "service": {
      "type": "nginx"
    },
    "host": {
      "name": "debian11"
    },
    "event": {
      "ingested": "2021-08-09T08:56:02.398057609Z",
      "original": "192.168.2.110 - - [09/Aug/2021:08:55:58 +0000] \"GET /favicon.ico HTTP/1.1\" 404 555 \"http://192.168.2.111:8080/\" \"Mozilla/5.0 (X11; Linux x86_64) AppleWebKit/537.36 (KHTML, like Gecko) Chrome/91.0.4472.164 Safari/537.36\" \"-\"",
      "timezone": "+00:00",
      "module": "nginx",
      "dataset": "nginx.ingress_controller"
    }
  },
  "fields": {
    "container.id": [
      "0b0ade2ce1fdee72d32db7b53ef566f9fe2314805cc1fa4b35649c7addb1c63a"
    ],
    "service.type": [
      "nginx"
    ],
    "agent.type": [
      "filebeat"
    ],
    "container.name": [
      "ingress"
    ],
    "container.image.name": [
      "nginx:1.21.1-alpine"
    ],
    "event.module": [
      "nginx"
    ],
    "stream": [
      "stdout"
    ],
    "kubernetes.container.image": [
      "nginx:1.21.1-alpine"
    ],
    "agent.name": [
      "debian11"
    ],
    "host.name": [
      "debian11"
    ],
    "event.timezone": [
      "+00:00"
    ],
    "docker.container.labels.maintainer": [
      "NGINX Docker Maintainers <docker-maint@nginx.com>"
    ],
    "event.original": [
      "192.168.2.110 - - [09/Aug/2021:08:55:58 +0000] \"GET /favicon.ico HTTP/1.1\" 404 555 \"http://192.168.2.111:8080/\" \"Mozilla/5.0 (X11; Linux x86_64) AppleWebKit/537.36 (KHTML, like Gecko) Chrome/91.0.4472.164 Safari/537.36\" \"-\""
    ],
    "fileset.name": [
      "ingress_controller"
    ],
    "input.type": [
      "container"
    ],
    "log.offset": [
      3343
    ],
    "agent.hostname": [
      "debian11"
    ],
    "docker.container.labels.co_elastic_logs/module": [
      "nginx"
    ],
    "container.labels.maintainer": [
      "NGINX Docker Maintainers <docker-maint@nginx.com>"
    ],
    "container.labels.co_elastic_logs/module": [
      "nginx"
    ],
    "event.ingested": [
      "2021-08-09T08:56:02.398Z"
    ],
    "@timestamp": [
      "2021-08-09T08:55:58.767Z"
    ],
    "agent.id": [
      "c73ef337-3347-4bf7-a753-9b11c3d48c3c"
    ],
    "ecs.version": [
      "1.10.0"
    ],
    "error.message": [
      "Provided Grok expressions do not match field value: [192.168.2.110 - - [09/Aug/2021:08:55:58 +0000] \\\"GET /favicon.ico HTTP/1.1\\\" 404 555 \\\"http://192.168.2.111:8080/\\\" \\\"Mozilla/5.0 (X11; Linux x86_64) AppleWebKit/537.36 (KHTML, like Gecko) Chrome/91.0.4472.164 Safari/537.36\\\" \\\"-\\\"]"
    ],
    "log.file.path": [
      "/var/lib/docker/containers/0b0ade2ce1fdee72d32db7b53ef566f9fe2314805cc1fa4b35649c7addb1c63a/0b0ade2ce1fdee72d32db7b53ef566f9fe2314805cc1fa4b35649c7addb1c63a-json.log"
    ],
    "agent.ephemeral_id": [
      "6bfa1f1f-917c-4bc6-9aa5-3b447362fab6"
    ],
    "agent.version": [
      "7.14.0"
    ],
    "event.dataset": [
      "nginx.ingress_controller"
    ]
  }
}