Introduction into FB Prophet

Working with multiple Python Versions on Arch Linux
Issues with PyStan cannot get it - as a FBProphet dependency - installed on Python v3.9. So I had to add an older version:
sudo pacman -S yay
yay -S python37
Verify that you can use it - and your main version is not broken:
python --version
Python 3.9.7

python3.7 --version
Python 3.7.12
Setting up an Virtual Environment
Create a virtual environment using the Python version:
python3.7 -m venv venv
source venv/bin/activate
Verify that you get the older version from inside the environment:
python --version
Python 3.7.12
Installation
I created a dependency file to install everything in one go - but this would install the incorrect version of PyStan for FBProphet. Just pre-install the correct version by hand and the Prophet installer will skip this step and continue it's work:
pip install pystan==2.19.1.1
Since I am going to work in a jupyter notebook I also need to install and to make some preparation to have it use the old version of Python:
pip install ipykernel
python3.7 -m ipykernel install --user --name=prophet
Now I can create the dependencies.txt file:
jupyter
pandas
plotly
matplotlib
fbprophet
And install it:
pip install -r dependencies.txt
Success! Getting to work now :)
Jupyter Notebook
Start the environment:
jupyter notebook
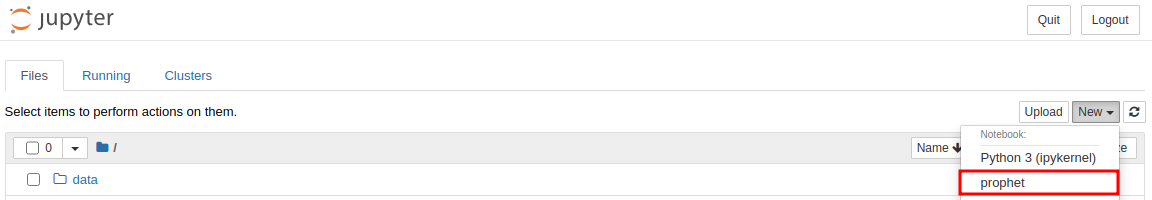
And create a new notebook using the iPyKernel created earlier:
Now I can check if my environment actually works by importing all the libraries I am going to need into my notebook:
import pandas as pd
import matplotlib.pyplot as pp
from fbprophet import Prophet
from fbprophet.diagnostics import cross_validation
from fbprophet.diagnostics import performance_metrics
from fbprophet.plot import plot_cross_validation_metric
When this cell runs without errors - you are good to go!
Importing Data
I want to use the Data on the daily number of new reported COVID-19 cases and deaths by EU/EEA country. I extracted countries of interest from the available Excel file and saved them into data/*.csv files. I can import them into the notebook with:
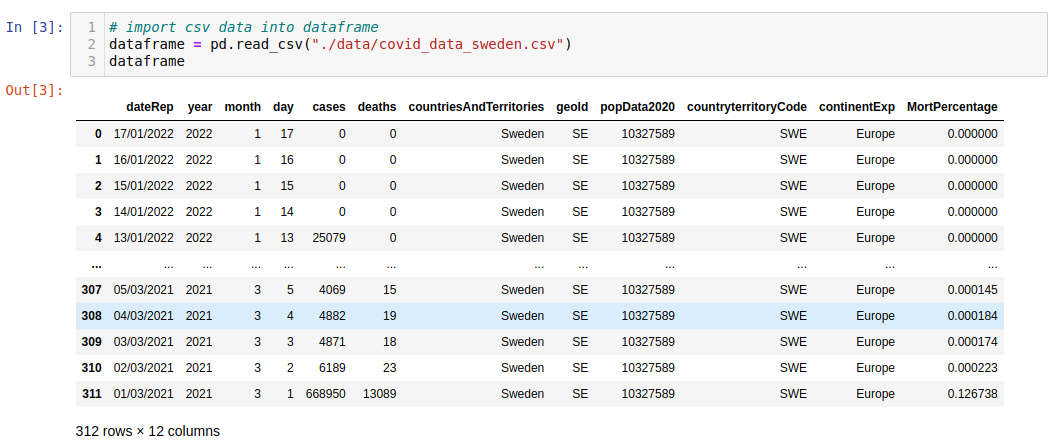
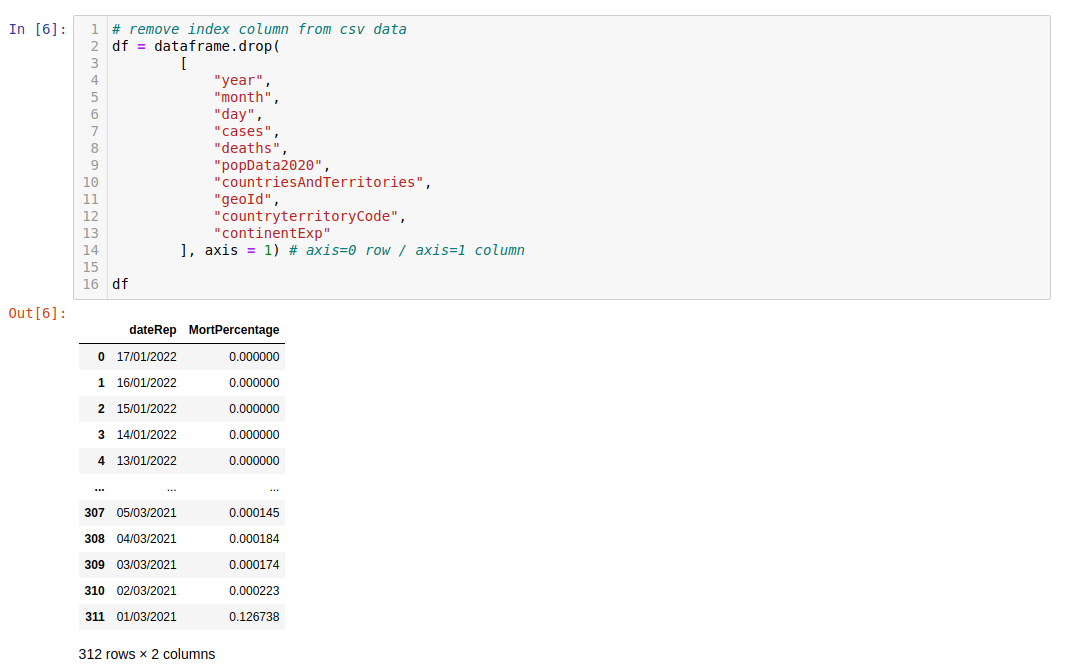
I brought in all columns into the Panda data frame. But for now I want to concentrate only on the mortality rate of covid - how many people have died from this disease that has changed all of our life as a percentage to the entire population of the country:
Prophet requires us to rename the columns:
# Rename date and value column names for Facebook Prophet
df.rename(columns = {
    "dateRep": "ds",
    "MortPercentage": "y"
}, inplace = True)
And we can take a look at our data by plotting it:
pp.style.use("ggplot")
graph = df.set_index("ds").plot(figsize=(20,10))
graph.set_title("Relative Mortality - COVID19")
graph.set_xlabel("Date")
graph.set_ylabel("Death rel. to Population [%]")
pp.show()
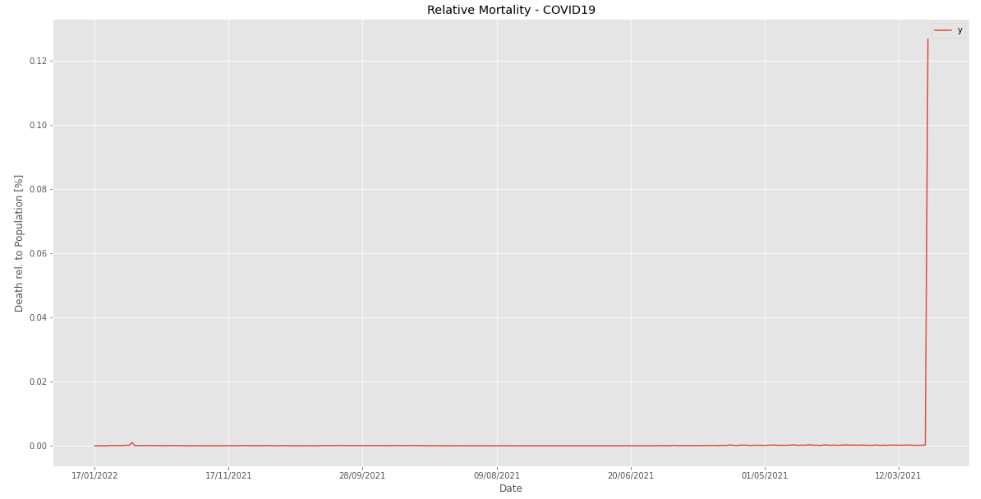
The data is almost a flat line for most of the pandemic with a stark increase at the beginning of 2022 (delayed deaths after the holidays? Early Omicron effect?). And it looks identical to the graph I am getting for all the EU countries I tested. It is not ideal to train a prediction model on.
So I added a column to my data where I added up all deaths and re-plotted:
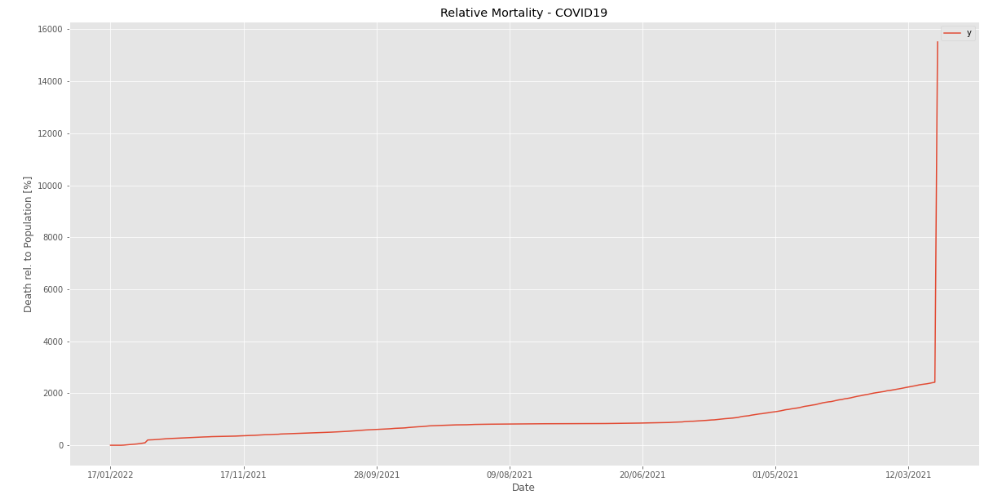
Now I can see a steady increase. There is still this explosion at the end that will throw off the prediction model. But let's see what Prophet does with this data set.
Using Prophet
Fit a Model
# Fit a model with Prophet
INTERVAL_WIDTH = 0.9
model = Prophet(interval_width = INTERVAL_WIDTH,
                daily_seasonality=True)

model.fit(df)
Iter      log prob        ||dx||      ||grad||       alpha      alpha0  # evals  Notes
      99       724.378    0.00718031       139.315      0.3324           1      135
    Iter      log prob        ||dx||      ||grad||       alpha      alpha0  # evals  Notes
     124       725.949   0.000456015       117.735   3.512e-06       0.001      214  LS failed, Hessian reset
     187       727.661   0.000866116        167.82   1.014e-05       0.001      346  LS failed, Hessian reset
     199       727.942    0.00199099       72.1614           1           1      363
    Iter      log prob        ||dx||      ||grad||       alpha      alpha0  # evals  Notes
     214       728.179   0.000101734       24.5358   2.882e-06       0.001      421  LS failed, Hessian reset
     256         728.5   0.000721259       107.772   7.301e-06       0.001      510  LS failed, Hessian reset
     299        728.54   5.93182e-06       68.6047           1           1      566
    Iter      log prob        ||dx||      ||grad||       alpha      alpha0  # evals  Notes
     317       728.541   1.73007e-05       56.2555   1.914e-07       0.001      635  LS failed, Hessian reset
     338       728.542   7.27887e-08       37.9324      0.2247           1      671
Optimization terminated normally:
  Convergence detected: relative gradient magnitude is below tolerance
Make Prediction
# Make predictions with Prophet
NUMBER_OF_PERIODS = 100
pred_df = model.make_future_dataframe(periods = NUMBER_OF_PERIODS)
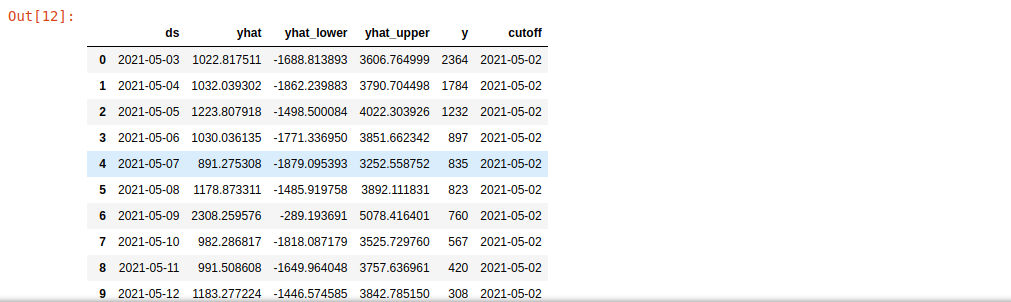
prediction = model.predict(pred_df)
pred_100_days = prediction[["yhat"]].iloc[[-1]]
pred_100_days
| yhat | |
|---|---|
| 411 | -849.961226 |
Model Performance
# Analyze model performance
df_xeval = cross_validation(model,
                            initial="100 days",
                            period="50 days",
                            horizon="10 days")
df_xeval
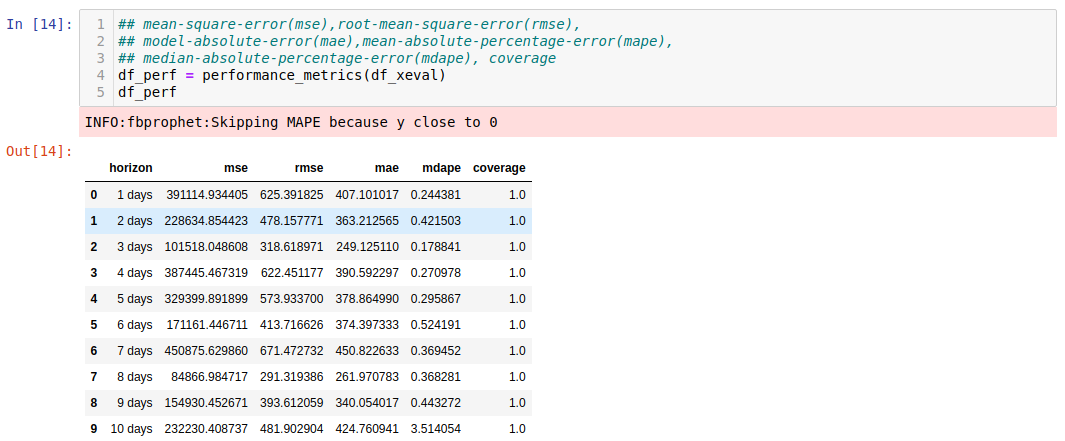
## mean-square-error(mse),root-mean-square-error(rmse),
## model-absolute-error(mae),mean-absolute-percentage-error(mape),
## median-absolute-percentage-error(mdape), coverage
df_perf = performance_metrics(df_xeval)
df_perf
Print different error messages:
plot_cross_validation_metric(df_xeval, metric="mse")

plot_cross_validation_metric(df_xeval, metric="rmse")

plot_cross_validation_metric(df_xeval, metric="mae")

plot_cross_validation_metric(df_xeval, metric="mape")

plot_cross_validation_metric(df_xeval, metric="mdape")

plot_cross_validation_metric(df_xeval, metric="coverage")