
See also:
- Fun, fun, tensors: Tensor Constants, Variables and Attributes, Tensor Indexing, Expanding and Manipulations, Matrix multiplications, Squeeze, One-hot and Numpy
- Tensorflow 2 - Neural Network Regression: Building a Regression Model, Model Evaluation, Model Optimization, Working with a "Real" Dataset, Feature Scaling
- Tensorflow 2 - Neural Network Classification: Non-linear Data and Activation Functions, Model Evaluation and Performance Improvement, Multiclass Classification Problems
- Tensorflow 2 - Convolutional Neural Networks: Binary Image Classification, Multiclass Image Classification
- Tensorflow 2 - Transfer Learning: Feature Extraction, Fine-Tuning, Scaling
- Tensorflow 2 - Unsupervised Learning: Autoencoder Feature Detection, Autoencoder Super-Resolution, Generative Adverserial Networks
Tensorflow Neural Network Regression
Model Evaluation
Create a new Dataset
# create a new feature matrix
X = tf.range(-100, 100, 4)
X
# <tf.Tensor: shape=(50,), dtype=int32, numpy=
# array([-100,  -96,  -92,  -88,  -84,  -80,  -76,  -72,  -68,  -64,  -60,
#         -56,  -52,  -48,  -44,  -40,  -36,  -32,  -28,  -24,  -20,  -16,
#         -12,   -8,   -4,    0,    4,    8,   12,   16,   20,   24,   28,
#          32,   36,   40,   44,   48,   52,   56,   60,   64,   68,   72,
#          76,   80,   84,   88,   92,   96], dtype=int32)>
# create labels for those features that follow a pattern
y = X + 10
y
# <tf.Tensor: shape=(50,), dtype=int32, numpy=
# array([-90, -86, -82, -78, -74, -70, -66, -62, -58, -54, -50, -46, -42,
#        -38, -34, -30, -26, -22, -18, -14, -10,  -6,  -2,   2,   6,  10,
#         14,  18,  22,  26,  30,  34,  38,  42,  46,  50,  54,  58,  62,
#         66,  70,  74,  78,  82,  86,  90,  94,  98, 102, 106], dtype=int32)>
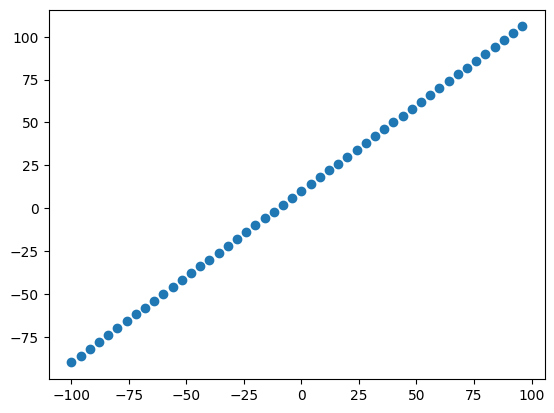
# visualize the data
plt.scatter(X,y)
Train-Test Datasplit
len(X)
# 50 => 80:20 split
X_train = X[:40] # take first 80% of features
X_test = X[40:] # take last 20% of features
y_train = y[:40] # take first 80% of lables
y_test = y[40:] # take last 20% of lables

len(X_train), len(X_test), len(y_train), len(y_test)
# (40, 10, 40, 10)
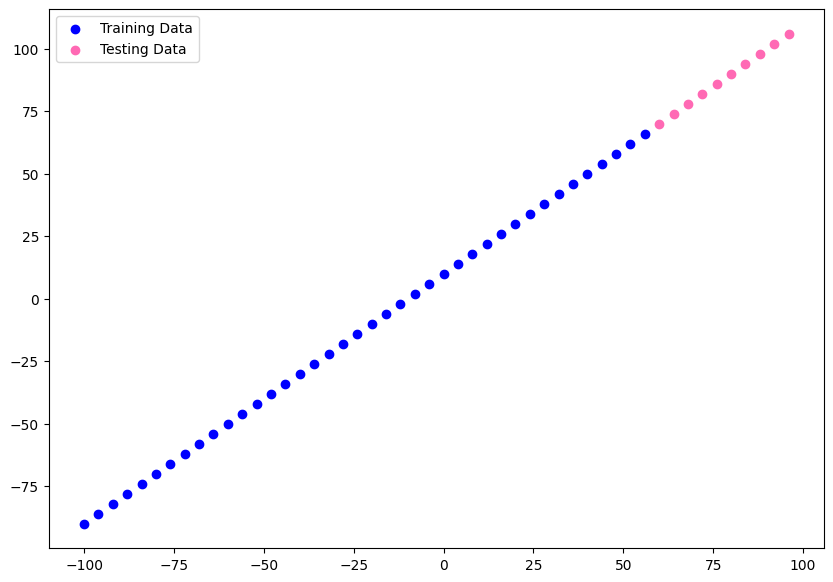
# visualize datasets
plt.figure(figsize=(10,7))
plt.scatter(X_train, y_train, color="blue", label="Training Data")
plt.scatter(X_test, y_test, color="hotpink", label="Testing Data")
plt.legend()
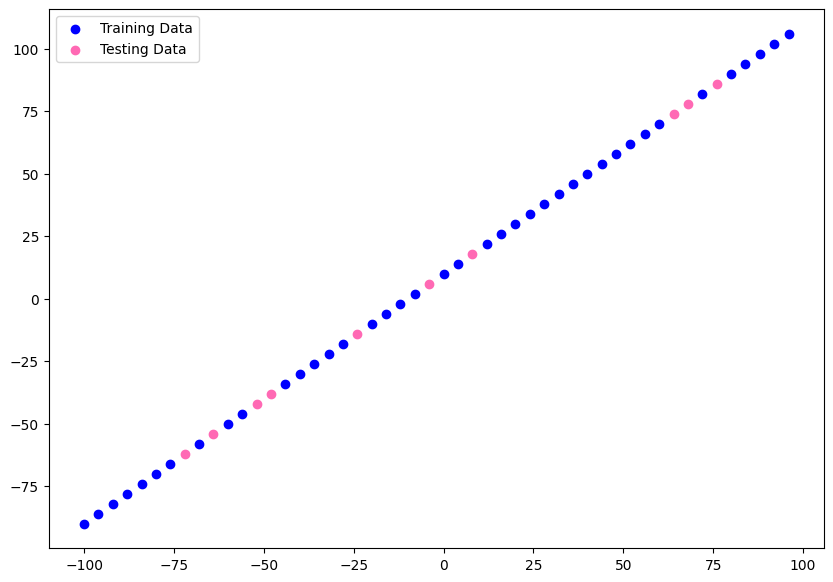
# to get around biases it is better to shuffle your data
# first create random indices to be able to shuffle
# both features and lables by the same order
indices = tf.range(start=0, limit=tf.shape(X)[0], dtype=tf.int32)
shuffled_indices = tf.random.shuffle(indices)

# use random indices to shuffle both tensors
X_random = tf.gather(X, shuffled_indices)
y_random = tf.gather(y, shuffled_indices)

# re-split
X_train = X_random[:40] # take first 80% of features
X_test = X_random[40:] # take last 20% of features
y_train = y_random[:40] # take first 80% of lables
y_test = y_random[40:] # take last 20% of lables

# visualize datasets
plt.figure(figsize=(10,7))
plt.scatter(X_train, y_train, color="blue", label="Training Data")
plt.scatter(X_test, y_test, color="hotpink", label="Testing Data")
plt.legend()
Create the Model
tf.random.set_seed(42)

model = tf.keras.Sequential([
    layers.Dense(1, input_shape=[1], name="input_layer"),
    layers.Dense(128, activation="relu", name="dense_layer1"),
    layers.Dropout(.25, name="dropout"),
    layers.Dense(64, activation="relu", name="dense_layer2"),
    layers.Dense(1, name="output_layer")
], name="my_model")
    # input and output shape is 1 - we input 1 value and create a 1 value prediction

model.compile(
    loss=tf.keras.losses.mae,
    optimizer=optimizers.Adam(learning_rate=0.01),
    metrics="mae")
Visualize the Model
model.summary()
# Model: "my_model"
# _________________________________________________________________
#  Layer (type)                Output Shape              Param #
# =================================================================
#  input_layer (Dense)         (None, 1)                 2

#  dense_layer1 (Dense)        (None, 128)               256

#  dropout (Dropout)           (None, 128)               0

#  dense_layer2 (Dense)        (None, 64)                8256

#  output_layer (Dense)        (None, 1)                 65

# =================================================================
# Total params: 8,579
# Trainable params: 8,579
# Non-trainable params: 0
# _________________________________________________________________
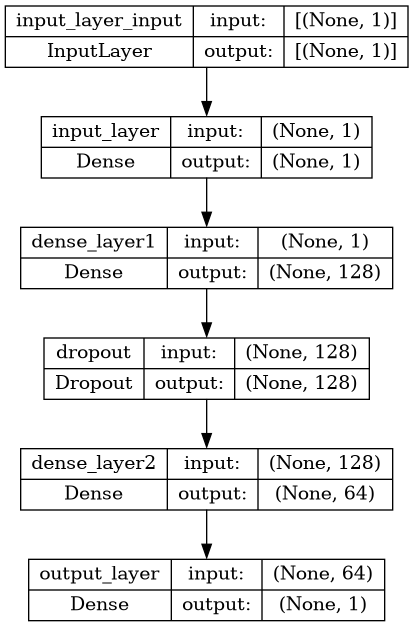
# plot the model
from tensorflow.keras.utils import plot_model

plot_model(model=model, show_shapes=True, show_layer_names=True, expand_nested=False)
model.fit(X_train, y_train, validation_data=(X_test, y_test), epochs=99)
# Epoch 99/99
# 2/2 [==============================] - 0s 25ms/step - loss: 3.1461 - mae: 3.1461 - val_loss: 3.8707 - val_mae: 3.8707
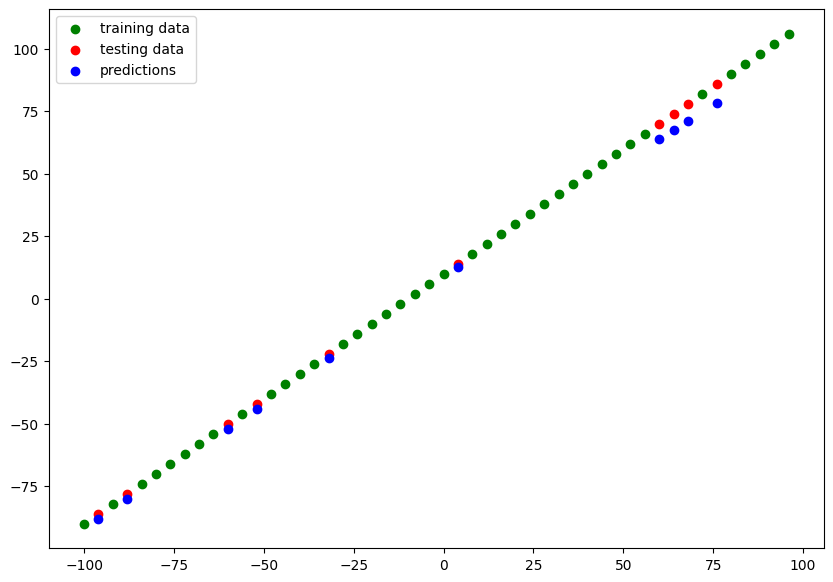
Visualize Predictions
# make predictions
y_pred = model.predict(X_test)

# predicted values & true values
tf.constant(y_pred), y_test
# (<tf.Tensor: shape=(10, 1), dtype=float32, numpy=
#  array([[-44.232136],
#         [-88.13068 ],
#         [ 71.16495 ],
#         [-80.16996 ],
#         [-23.712166],
#         [ 63.83241 ],
#         [-52.232437],
#         [ 67.49867 ],
#         [ 78.4975  ],
#         [ 12.77635 ]], dtype=float32)>,
#  <tf.Tensor: shape=(10,), dtype=int32, numpy=array([-42, -86,  78, -78, -22,  70, -50,  74,  86,  14], dtype=int32)>)
# plot train/test and compare predictions to ground truth
def plot_predictions(
    train_data=X_train,
    train_labels=y_train,
    test_data=X_test,
    test_labels=y_test,
    predictions=y_pred):

    plt.figure(figsize=(10,7))
    plt.scatter(train_data, train_labels, color="green", label="training data")
    plt.scatter(test_data, test_labels, color="red", label="testing data")
    plt.scatter(test_data, predictions, color="blue", label="predictions")
    plt.legend()
# blue dots should line up with red dots for a perfect prediction
plot_predictions(X_train, y_train, X_test, y_test)
Regression Evaluation Metrics
Regression Metrics:
tf.keras.losses.MAE(),tf.metrics.mean_absolute_error()- Mean absolute error (absolute value my predictions - on average - will be off)tf.keras.losses.MSE(),tf.metrics.mean_suared_error()- Mean square error (squared average error)tf.keras.losses.Huber()- Combination of MAE & MSE (less sensitive to outliers)
# get loss & metrics value in test mode
model.evaluate(X_test, y_test)
# since lossfunction & metrics are set to MAE we get the absolute error:
# [3.8707497119903564, 3.8707497119903564]
Absolute Error
# to compare y_test with y_pred we must make sure they have the same shape
y_test.shape, y_pred.shape
# (TensorShape([10]), (10, 1))

# removing extra dimension from prediction array
y_pred_squeezed = tf.squeeze(y_pred)
y_pred_squeezed.shape
# TensorShape([10])
# calculate the MAE
mae = tf.metrics.mean_absolute_error(y_true=y_test, y_pred=y_pred_squeezed)

# this returns the same value for the absolute error as the eval method above
mae
# <tf.Tensor: shape=(), dtype=float32, numpy=3.8707497>
Squared Error
# calculate the MAE
mse = tf.metrics.mean_squared_error(y_true=y_test, y_pred=y_pred_squeezed)
mse
# <tf.Tensor: shape=(), dtype=float32, numpy=20.695545>
# function to calculate both errors
def squared_and_absolute_error(y_true, y_pred):
    mae = tf.metrics.mean_absolute_error(y_true, y_pred)
    mse = tf.metrics.mean_squared_error(y_true, y_pred)

    return mae, mse

squared_and_absolute_error(y_true=y_test, y_pred=y_pred_squeezed)
# (<tf.Tensor: shape=(), dtype=float32, numpy=3.8707497>,
#  <tf.Tensor: shape=(), dtype=float32, numpy=20.695545>)