
Dimensionality Reduction for Image Segmentation
Use Manifold Learning and the LD Analysis to Visualize Image Datasets.
Local Linear Embedding
import matplotlib.pyplot as plt
import plotly.express as px
import pandas as pd
import seaborn as sns
from sklearn.datasets import load_digits
from sklearn.manifold import LocallyLinearEmbedding
Digits Dataset
# load digits dataset with labels
X,y = load_digits(return_X_y=True)
X.shape
# (images, features)
# (1797, 64)
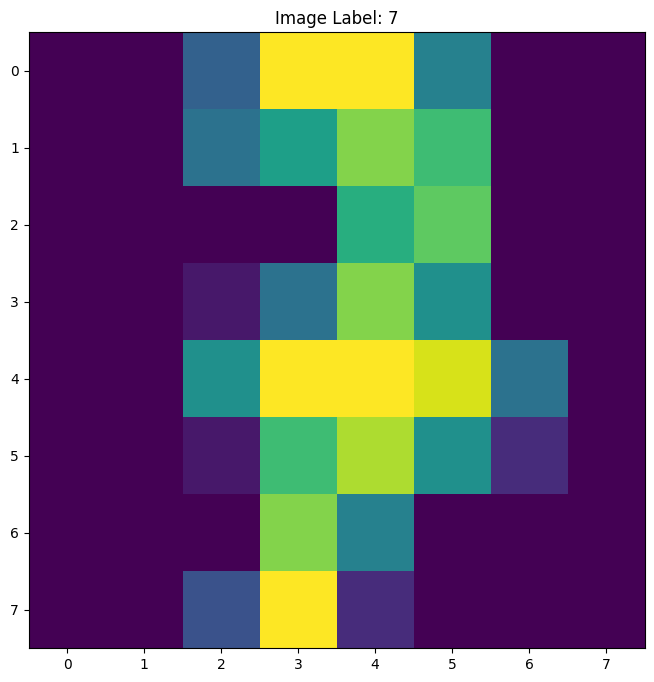
plt.figure(figsize=(8,8))
plt.title('Image Label: ' + str(y[888]))
plt.imshow(X[888].reshape(8,8))
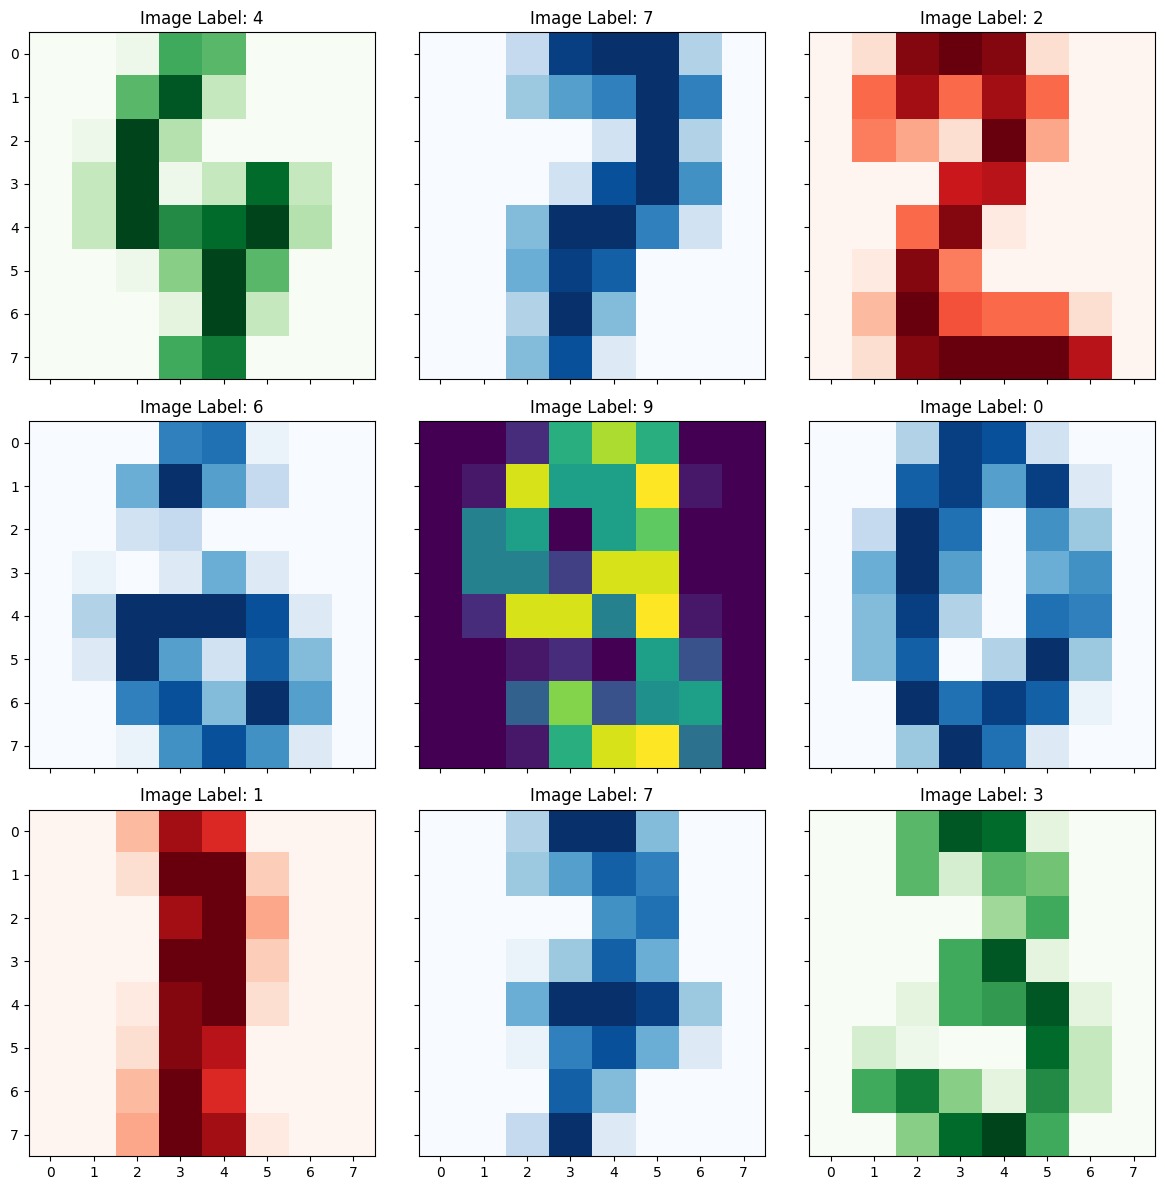
fig, axes = plt.subplots(nrows=3, ncols=3, sharex=True, sharey=True, figsize=(12,12))
axes[0,0].title.set_text('Image Label: ' + str(y[111]))
axes[0,0].imshow(X[111].reshape(8,8), cmap='Greens')
axes[0,1].title.set_text('Image Label: ' + str(y[222]))
axes[0,1].imshow(X[222].reshape(8,8), cmap='Blues')
axes[0,2].title.set_text('Image Label: ' + str(y[333]))
axes[0,2].imshow(X[333].reshape(8,8), cmap='Reds')
axes[1,0].title.set_text('Image Label: ' + str(y[444]))
axes[1,0].imshow(X[444].reshape(8,8), cmap='Blues')
axes[1,1].title.set_text('Image Label: ' + str(y[555]))
axes[1,1].imshow(X[555].reshape(8,8))
axes[1,2].title.set_text('Image Label: ' + str(y[666]))
axes[1,2].imshow(X[666].reshape(8,8), cmap='Blues')
axes[2,0].title.set_text('Image Label: ' + str(y[777]))
axes[2,0].imshow(X[777].reshape(8,8), cmap='Reds')
axes[2,1].title.set_text('Image Label: ' + str(y[888]))
axes[2,1].imshow(X[888].reshape(8,8), cmap='Blues')
axes[2,2].title.set_text('Image Label: ' + str(y[999]))
axes[2,2].imshow(X[999].reshape(8,8), cmap='Greens')
plt.tight_layout()
2-Dimensional Plot
# the dataset has 1797 images with 64 dimensions
# we use LLE to reduce the dimensionality of the dataset
# to help us visualize / classify it
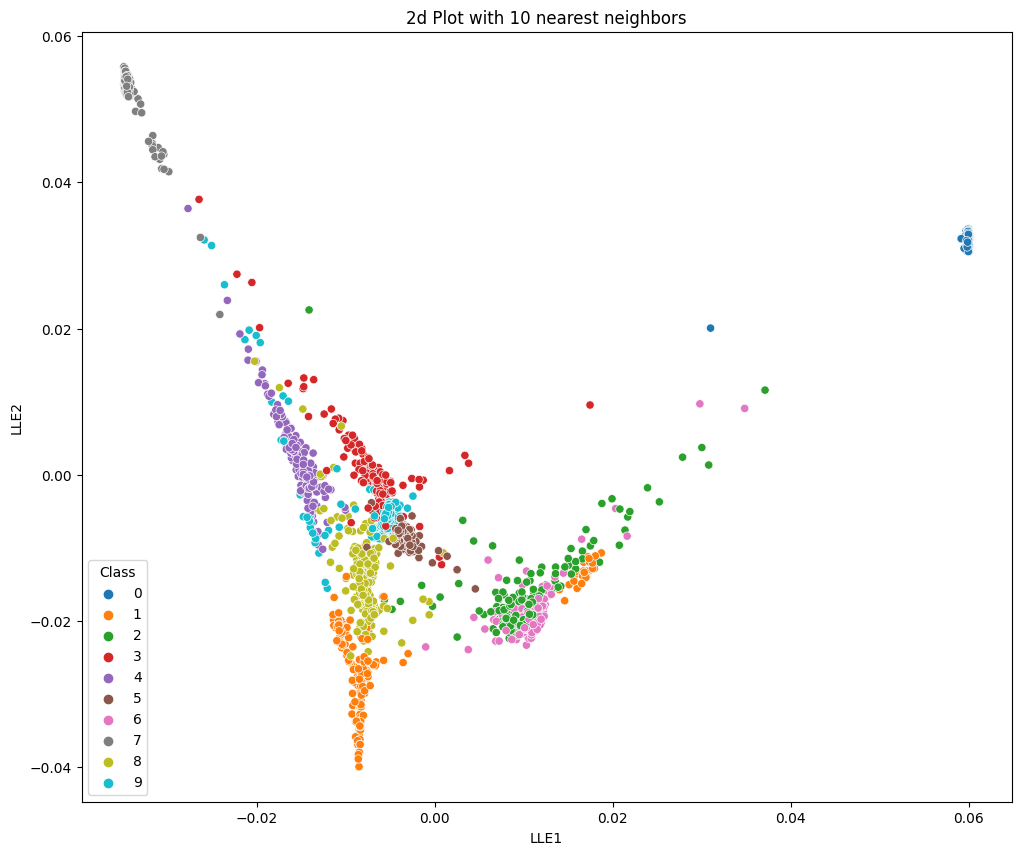
no_components=2
no_neighbors=10

lle = LocallyLinearEmbedding(n_components=no_components, n_neighbors=no_neighbors)
X_lle = lle.fit_transform(X, y=y)

data = pd.DataFrame({'LLE1': X_lle[ :,0], 'LLE2': X_lle[ :,1], 'Class': y})

plt.figure(figsize=(12, 10))
plt.title('2d Plot with 10 nearest neighbors')
sns.scatterplot(x='LLE1', y='LLE2', hue='Class', data=data, palette='tab10')
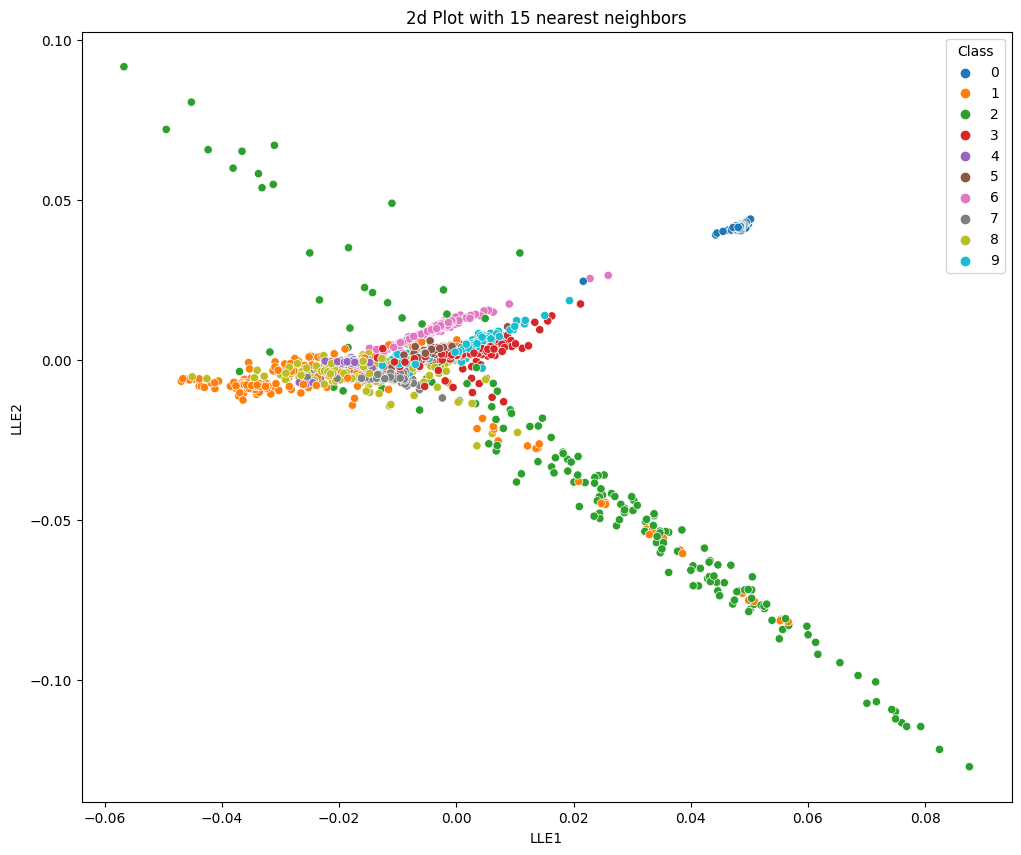
no_neighbors=15

lle = LocallyLinearEmbedding(n_components=no_components, n_neighbors=no_neighbors)
X_lle = lle.fit_transform(X, y=y)

data = pd.DataFrame({'LLE1': X_lle[ :,0], 'LLE2': X_lle[ :,1], 'Class': y})

plt.figure(figsize=(12, 10))
plt.title('2d Plot with 15 nearest neighbors')
sns.scatterplot(x='LLE1', y='LLE2', hue='Class', data=data, palette='tab10')
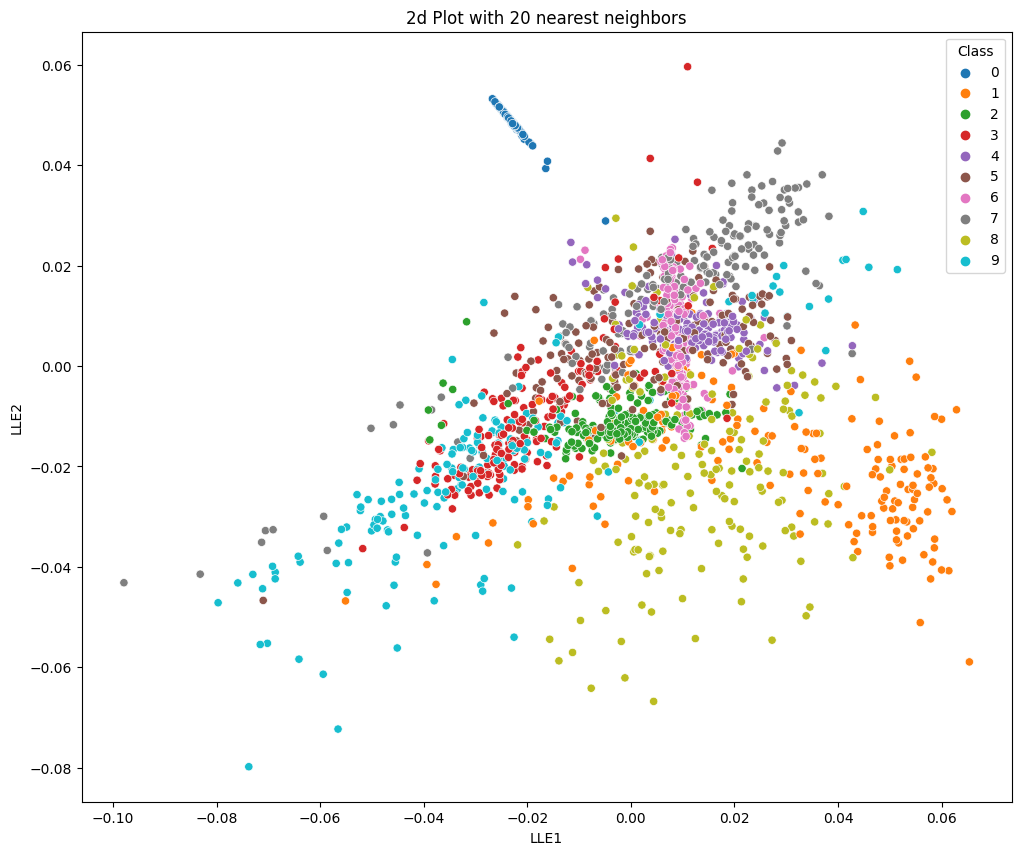
no_neighbors=20

lle = LocallyLinearEmbedding(n_components=no_components, n_neighbors=no_neighbors)
X_lle = lle.fit_transform(X, y=y)

data = pd.DataFrame({'LLE1': X_lle[ :,0], 'LLE2': X_lle[ :,1], 'Class': y})

plt.figure(figsize=(12, 10))
plt.title('2d Plot with 20 nearest neighbors')
sns.scatterplot(x='LLE1', y='LLE2', hue='Class', data=data, palette='tab10')
3-Dimensional Plot
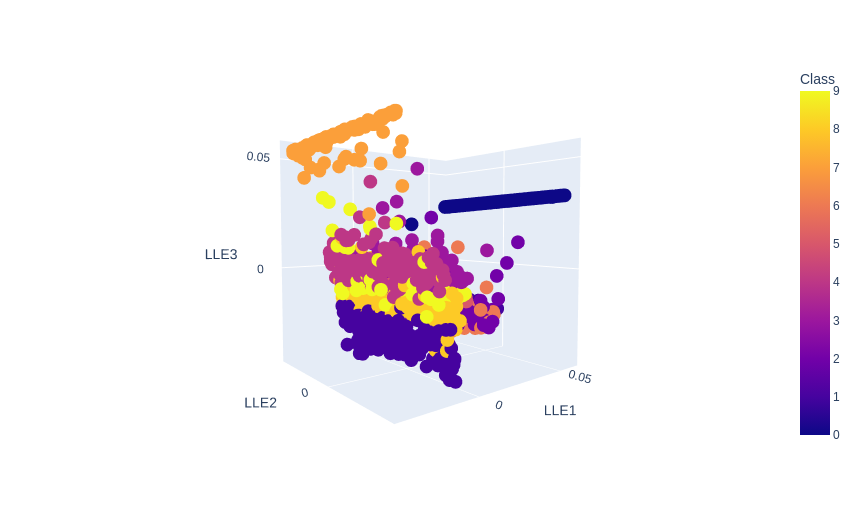
no_components=3
no_neighbors=10

lle = LocallyLinearEmbedding(n_components=no_components, n_neighbors=no_neighbors)
X_lle = lle.fit_transform(X, y=y)

data = pd.DataFrame({
    'LLE1': X_lle[ :,0],
    'LLE2': X_lle[ :,1],
    'LLE3': X_lle[ :,2],
    'Class': y})

# data.head()

plot = px.scatter_3d(
    data,
    x = 'LLE1',
    y = 'LLE2',
    z = 'LLE3',
    color='Class')

plot.show()
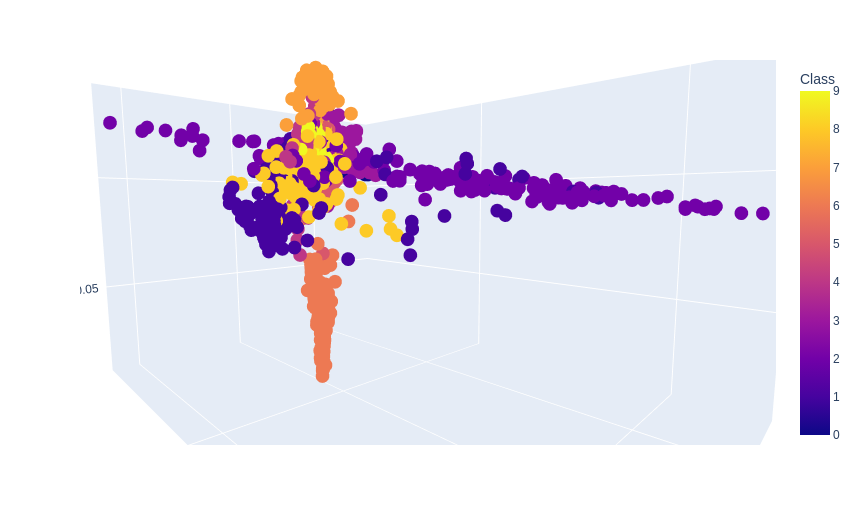
no_components=3
no_neighbors=15

lle = LocallyLinearEmbedding(n_components=no_components, n_neighbors=no_neighbors)
X_lle = lle.fit_transform(X, y=y)

data = pd.DataFrame({
    'LLE1': X_lle[ :,0],
    'LLE2': X_lle[ :,1],
    'LLE3': X_lle[ :,2],
    'Class': y})

# data.head()

plot = px.scatter_3d(
    data,
    x = 'LLE1',
    y = 'LLE2',
    z = 'LLE3',
    color='Class')

plot.show()
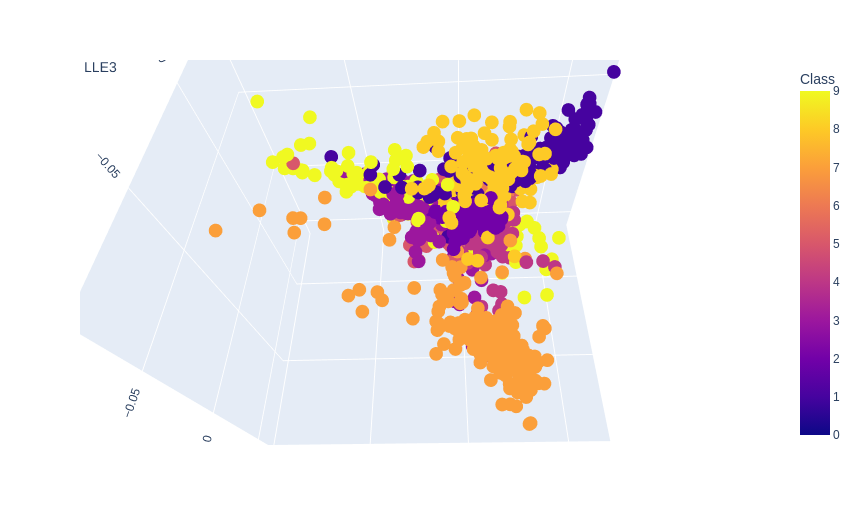
no_components=3
no_neighbors=20

lle = LocallyLinearEmbedding(n_components=no_components, n_neighbors=no_neighbors)
X_lle = lle.fit_transform(X, y=y)

data = pd.DataFrame({
    'LLE1': X_lle[ :,0],
    'LLE2': X_lle[ :,1],
    'LLE3': X_lle[ :,2],
    'Class': y})

# data.head()

plot = px.scatter_3d(
    data,
    x = 'LLE1',
    y = 'LLE2',
    z = 'LLE3',
    color='Class')

plot.show()
Principal Component Analysis
import matplotlib.pyplot as plt
import plotly.express as px
import pandas as pd
import seaborn as sns
from sklearn.datasets import load_digits
from sklearn.decomposition import PCA
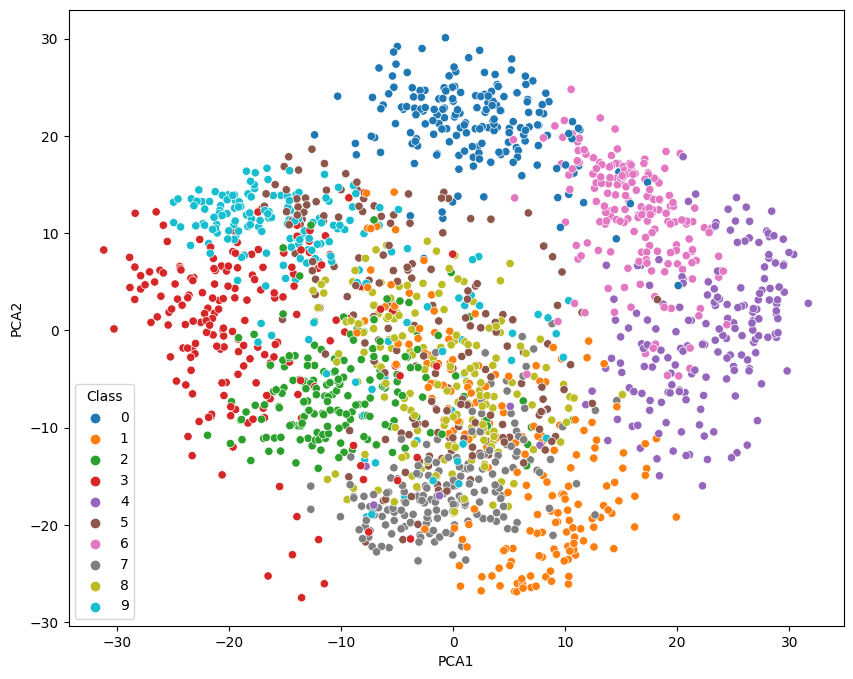
2-Dimensional Plot
no_components = 2
pca = PCA(n_components=no_components).fit(X)
X_pca = pca.transform(X)

data = pd.DataFrame({
    'PCA1': X_pca[:,0],
    'PCA2': X_pca[:,1],
    'Class': y})

fig = plt.figure(figsize=(10, 8))
sns.scatterplot(
    x='PCA1',
    y='PCA2',
    hue='Class',
    palette='tab10',
    data=data)
3-Dimensional Plot
no_components = 3
pca = PCA(n_components=no_components).fit(X)
X_pca = pca.transform(X)

data = pd.DataFrame({
    'PCA1': X_pca[:,0],
    'PCA2': X_pca[:,1],
    'PCA3': X_pca[:,2],
    'Class': y})

plot = px.scatter_3d(
    data,
    x = 'PCA1',
    y = 'PCA2',
    z = 'PCA3',
    color='Class')

plot.show()

Fisher Discriminant Analysis
import matplotlib.pyplot as plt
import plotly.express as px
import pandas as pd
import seaborn as sns
from sklearn.datasets import load_digits
from sklearn.discriminant_analysis import LinearDiscriminantAnalysis
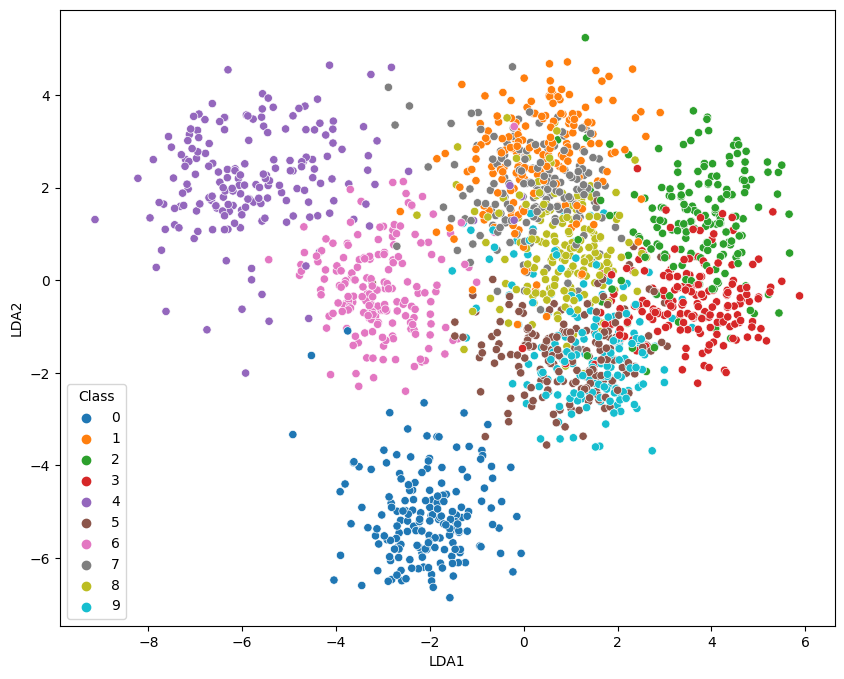
2-Dimensional Plot
no_components = 2

lda = LinearDiscriminantAnalysis(n_components = no_components)
X_lda = lda.fit_transform(X , y=y)

data = pd.DataFrame({
    'LDA1': X_lda[:,0],
    'LDA2': X_lda[:,1],
    'Class': y})
fig = plt.figure(figsize=(10, 8))
sns.scatterplot(
    x='LDA1',
    y='LDA2',
    hue='Class',
    data=data,
    palette='tab10')
3-Dimensional Plot
no_components = 3

lda = LinearDiscriminantAnalysis(n_components = no_components)
X_lda = lda.fit_transform(X , y=y)

data = pd.DataFrame({
    'LDA1': X_lda[:,0],
    'LDA2': X_lda[:,1],
    'LDA3': X_lda[:,2],
    'Class': y})

plot = px.scatter_3d(
    data,
    x = 'LDA1',
    y = 'LDA2',
    z = 'LDA3',
    color='Class')

plot.show()

Isometric Mapping
import matplotlib.pyplot as plt
import plotly.express as px
import pandas as pd
import seaborn as sns
from sklearn.datasets import load_digits
from sklearn.manifold import Isomap
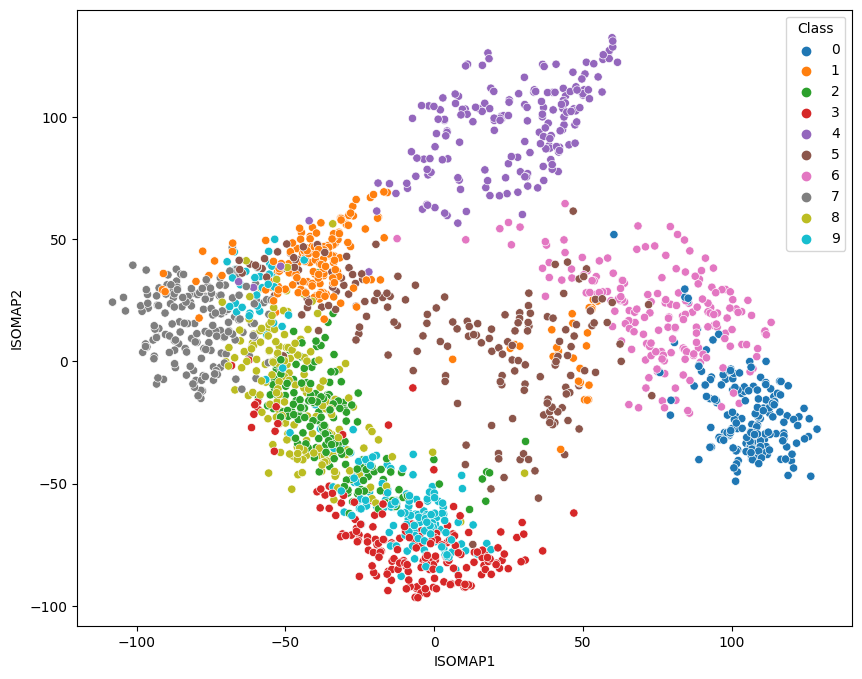
2-Dimensional Plot
no_components = 2
k_nearest_neighbors = 10

isomap = Isomap(
    n_components=no_components,
    n_neighbors=k_nearest_neighbors)

X_iso = isomap.fit_transform(X)
print('Reconstruction Error: ', isomap.reconstruction_error())
# Reconstruction Error:  3092.669294495556

data = pd.DataFrame({
    'ISOMAP1': X_iso[:,0],
    'ISOMAP2': X_iso[:,1],
    'Class': y})
fig = plt.figure(figsize=(10, 8))
sns.scatterplot(
    x='ISOMAP1',
    y='ISOMAP2',
    hue='Class',
    data=data,
    palette='tab10')
3-Dimensional Plot
no_components = 3
k_nearest_neighbors = 10

isomap = Isomap(
    n_components=no_components,
    n_neighbors=k_nearest_neighbors)

X_iso = isomap.fit_transform(X)
print('Reconstruction Error: ', isomap.reconstruction_error())
# Reconstruction Error:  2522.73434274533

data = pd.DataFrame({
    'ISOMAP1': X_iso[:,0],
    'ISOMAP2': X_iso[:,1],
    'ISOMAP3': X_iso[:,2],
    'Class': y})
plot = px.scatter_3d(
    data,
    x = 'ISOMAP1',
    y = 'ISOMAP2',
    z = 'ISOMAP3',
    color='Class')

plot.show()
